Learn about the City’s long-term financial strategies in the budget manual.
On this page
Funding Strategy Overview
During the preparation of the 2024 – 2027 Multi-Year Budget (MYB), staff built the 10 year capital budget and forecast based on the service delivery master plans, factoring in the high inflation of the previous few years. Even after multiple revisions of the capital budget, and reductions of $693.7 million out of the first four years, staff were not able to get to a fully funded capital budget and forecast. Staff communicated this to Council, and received direction to continue the work of prioritizing capital projects to bring back a fully funded capital budget and forecast as part of the 2025 confirmed budget.
As part of the MYB, significant increases were built into the budget for capital funding, including phased-in catch up inflationary adjustments, a continued increase to funding for infrastructure renewal to work toward closing the asset management funding gap, and funding for projects supported under the 100RE and Service Enhancement strategies. To meet the 2025 Budget Mayoral Direction for a tax levy increase of not more than four per cent, the increase for tax supported capital funding was reduced. Further, an assumption was made that this level of increase in capital funding would also be fixed for the duration of the capital budget and forecast. This was a critical decision that provided the foundation for the capital prioritization work, as, to have a fully funded capital budget and forecast, assumptions about how much funding will be available over time are required. Adjustments were made to the amount of tax supported funding through Council budget amendments on November 27, 2024, and the figures below reflect the final 2025 confirmed budget, after amendments. These assumptions will be revisited through the next MYB cycle (2028–2031). The following are key revenue assumptions built into this forecast:
- The increases in the tax supported transfer for the Growth Strategy to support the creation of new housing units by funding development charge revenue losses were maintained.
- Funding for Infrastructure Renewal would be protected as much as possible, given the City’s known and growing infrastructure backlog.
- The Service Enhancement, Brownfield Renewal and 100RE funding envelopes were reduced to accommodate the Growth and Infrastructure Renewal increases.
These foundational assumptions set in motion significant capital prioritization work where every project in the City’s capital budget and forecast was prioritized in alignment with the criteria established (read more about this in the Capital Budget Summary). Once the budget adjustments were made to defer and re-sequence capital projects, the tax supported funding flowing into the Infrastructure Renewal, Service Enhancement, and 100RE reserve funds was adjusted between the reserve funds to align with the prioritized capital projects.
In reaching a fully funded capital budget and forecast, the objective was to have a positive balance in all capital reserve fund groupings by 2034 while minimizing cash flow pressures through the 10-year forecast. This was achieved in the proposed 2025 confirmed budget.
The individual financial strategies provide more detail about the reserve fund positions, projects funded, and pressures that remain. The updated plan relies on inter-reserve fund borrowing, and the use of debt throughout the forecast at the same level projected through the MYB. It is an ambitious capital plan, and it will require ongoing monitoring of capital reserve fund positions each year. Minimum reserve fund balance targets will not be met in some years, and there is potential for adjustments to capital projects through annual budget updates or future MYB cycles, if required based on reserve balances. Staff will also continue to seek out capital grant funding wherever possible to alleviate pressure on the reserve funds and debt strategy.
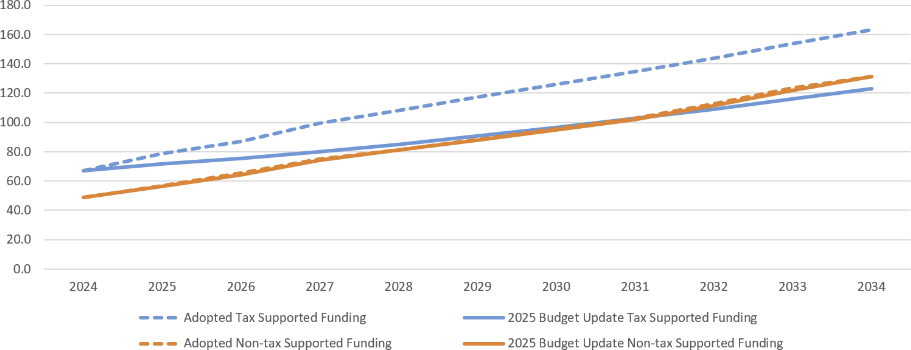
The graph in Figure 5 below compares the 10-year tax and non-tax funding in the adopted MYB to the 2025 confirmed budget.
Figure 5 10-year funding envelope for 2025 confirmed budget and adopted MYB:
View Figure 5 data
| Year | Adopted tax supported funding | 2025 confirmed budget tax supported funding | Adopted non-tax supported funding | 2025 confirmed budget non-tax supported funding |
|---|---|---|---|---|
| 2024 | 66.9 | 66.9 | 48.7 | 48.7 |
| 2025 | 78.7 | 73.4 | 56.9 | 56.4 |
| 2026 | 87.1 | 77.7 | 65.3 | 64.4 |
| 2027 | 99.6 | 81.3 | 75.1 | 74.4 |
| 2028 | 108.0 | 86.7 | 81.2 | 81.2 |
| 2029 | 117.2 | 92.6 | 88.1 | 87.8 |
| 2030 | 125.8 | 98.3 | 95.6 | 94.0 |
| 2031 | 134.6 | 104.7 | 102.7 | 101.8 |
| 2032 | 143.8 | 111.0 | 112.6 | 111.4 |
| 2033 | 153.6 | 118.0 | 123.5 | 121.8 |
| 2034 | 163.4 | 125.0 | 131.2 | 131.2 |
Infrastructure Renewal strategy
The Infrastructure Renewal (IR) Strategy funds the planned maintenance and replacement of City-owned assets. This strategy is directly linked to asset management planning—how we plan for and prioritize our infrastructure needs to achieve the greatest benefit to our community. Asset management planning is an ongoing and long-term process that identifies the requirements for maintaining the City’s assets in a state of good repair, including operation and maintenance, renewal, replacement, and disposal. This strategy helps ensure that the City can continue to provide a reasonable level of service to the community.
The Infrastructure Renewal Strategy is funded from multiple sources:
- property taxes;
- water, wastewater, stormwater, and parking rates;
- Canada Community-Building Fund (previously federal gas tax);
- Dedicated Gas Tax Funds for Public Transportation (provincial gas tax); and
- dividends from the City’s two wholly owned subsidiaries: Guelph Municipal Holdings Inc. (GMHI) and Guelph Junction Railway (GJR).
Sustainable funding outcome
According to the City’s most recent Asset Management Plan 2024 (AMP), the sustainable funding level for infrastructure renewal is $191 million. The AMP also identified an infrastructure backlog of $354.3 million (5.4 per cent of overall asset value).
Through the 2024 AMP, the sustainable funding level increased from the 2020 AMP by $21 million after adjusting for inflation. The 2024 AMP reviewed nearly 200,000 asset records in comparison to 97,000 in 2020, which contributed to this increase. There is also a higher quality of asset information in the updated AMP, which results in higher accuracy in the funding analysis.
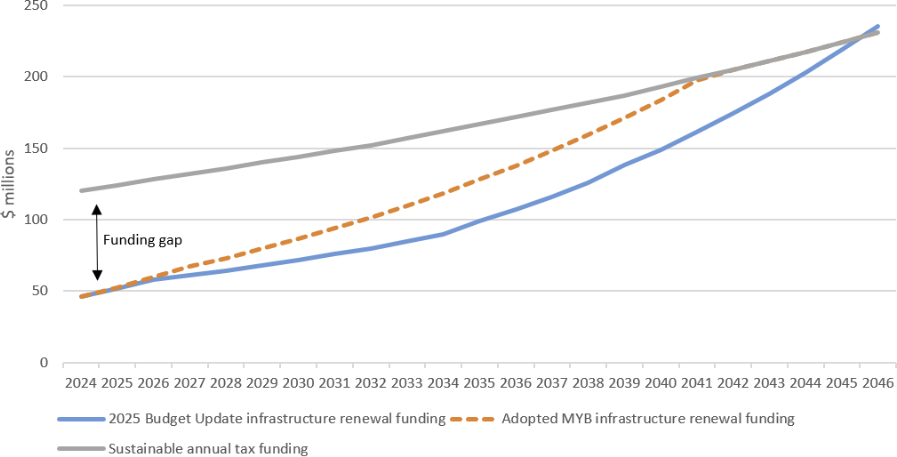
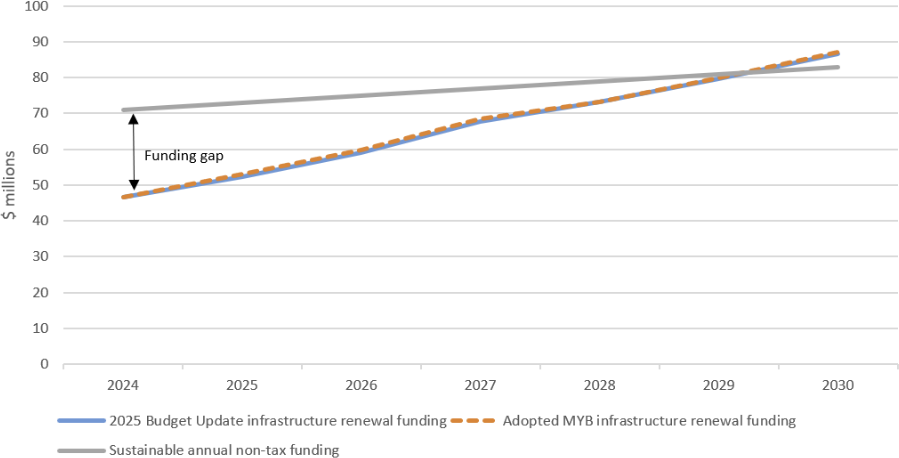
Figure 6 and 7 compare the annual funding level through the Infrastructure Renewal Strategy to the sustainable funding level target. The adopted budget funding levels are also included for comparison. The strategy in the previously-adopted multi-year budget (MYB) projected to reach the sustainable funding level by 2035 overall. Based on the updated funding needs as per the AMP, and the level of transfers in the 2025 confirmed budget, sustainable funding for asset management is projected to be reached in 2046 for tax-supported services and 2029 for non-tax supported services.
Changes to tax-supported funding levels for the Infrastructure Renewal Strategy in the 2025 confirmed budget have been developed to balance affordability with reducing risk associated with assets in the poorest conditions. With a reduced level of funding for tax-supported asset renewal, the City is able to advance less asset management work city-wide because of the integrated nature of the tax and non-tax supported assets. A significant portion of asset renewal work is related to integrated roadway reconstructions, which are funded by a combination of property tax (for the road renewal and enhancement portions), utility rates (for the underground pipes), and DC reserve funds (for the growth-enabling components of road and pipe replacements). To balance the tax-supported reserve funds by 2034, a significant number of integrated projects were deferred from the timelines contemplated in service delivery master plans. Reduced funding for this strategy means that it will take longer to close the gap on the sustainable funding level. This leads to lower asset condition ratings and can mean higher operating costs for regular maintenance, along with a higher risk of unplanned failures. Changes to the strategy will be discussed separately for tax and rate-supported services.
Figure 6 Annual sustainable funding level gap, tax-supported ($ millions)
View Figure 6 data
| Year | 2025 confirmed budget infrastructure renewal funding | Adopted MYB infrastructure renewal funding | Sustainable annual tax funding |
|---|---|---|---|
| 2024 | 46 | 46 | 120 |
| 2025 | 52 | 53 | 124 |
| 2026 | 58 | 60 | 128 |
| 2027 | 61 | 67 | 132 |
| 2028 | 64 | 73 | 136 |
| 2029 | 68 | 80 | 140 |
| 2030 | 72 | 86 | 144 |
| 2031 | 76 | 94 | 148 |
| 2032 | 80 | 102 | 152 |
| 2033 | 85 | 110 | 157 |
| 2034 | 90 | 119 | 162 |
| 2035 | 99 | 128 | 167 |
| 2036 | 107 | 138 | 172 |
| 2037 | 116 | 148 | 177 |
| 2038 | 126 | 159 | 182 |
| 2039 | 138 | 171 | 187 |
| 2040 | 149 | 184 | 193 |
| 2041 | 161 | 197 | 199 |
| 2042 | 174 | 205 | 205 |
| 2043 | 188 | 211 | 211 |
| 2044 | 203 | 217 | 217 |
| 2045 | 219 | 224 | 224 |
| 2046 | 235 | 231 | 231 |
Figure 7 Annual sustainable funding level gap, non-tax supported ($ millions):
View Figure 7 data
| Year | 2025 confirmed budget infrastructure renewal funding | Adopted MYB infrastructure renewal funding | Sustainable annual non-tax funding |
|---|---|---|---|
| 2024 | 47 | 47 | 71 |
| 2025 | 52 | 53 | 73 |
| 2026 | 59 | 60 | 75 |
| 2027 | 68 | 68 | 77 |
| 2028 | 73 | 73 | 79 |
| 2029 | 80 | 80 | 81 |
| 2030 | 87 | 87 | 83 |
Tax support for the Infrastructure Renewal Strategy
For tax-supported services, infrastructure renewal activities are funded from property taxes through the Infrastructure Renewal (150), Library Capital (157), and Police Capital (158) reserve funds, as well as external funding from upper levels of government, including the Canada Community-Building Fund (CCBF) and Dedicated Gas Tax (DGT).
Table 56 summarizes the annual infrastructure renewal funding for tax-supported services. An updated funding allocation was received for CCBF in 2024, and the forecast has been updated to reflect this increase in the allocation. The DGT forecast has been updated to reflect the 2024 allocation of DGT, which was a 5 per cent decrease from the 2023 allocation. The City maximizes the use of these external funding sources to lessen the impact on property taxes.
| Funding source | 2024 | 2025 | 2026 | 2027 | 2028 |
|---|---|---|---|---|---|
| Infrastructure Renewal (150) | 30.0 | 35.1 | 40.1 | 42.3 | 45.4 |
| Library Capital (157) | 0.3 | 0.3 | 0.3 | 0.4 | 0.4 |
| Police Capital (158) | 4.2 | 4.4 | 5.2 | 5.4 | 5.5 |
| DGT (342) | 3.0 | 3.0 | 3.0 | 3.0 | 3.0 |
| CCBF (343) | 9.0 | 9.4 | 9.4 | 9.8 | 9.8 |
| Total | 46.6 | 52.3 | 58.1 | 60.8 | 64.1 |
In 2025 and 2026, the IR Strategy can continue increasing with inflation plus the approved IR Strategy of adding 1 per cent of the overall tax levy annually on top of inflation, despite reducing the overall capital funding envelope. This is due to reductions in the Brownfield Renewal, Service Enhancement and 100RE strategies in these years. However, the prioritized capital budget does continue to include significant investment in Service Enhancement and 100RE initiatives, and therefore the overall envelope of tax-supported capital funding increases had to be split among these strategies, meaning that the 1 per cent annual increase in addition to inflation is no longer being achieved in 2027 and beyond. After that time, funding will continue to increase with inflation plus a varying portion of the dedicated infrastructure levy.
Through the Debt Strategy, the majority of the City’s debt capacity over the next several years was assigned to infrastructure renewal projects to advance more work than would otherwise have been possible.
As shown in Table 57, the Infrastructure Renewal reserve fund (150) has a positive balance at the end of 10 years but goes into significant deficits in 2025-2033, where it will need to borrow from other reserve funds. This will be closely monitored, as having a deficit in the reserve fund will reduce the City’s ability to manage unplanned asset failures. Adjustments to the timing of future capital projects may be required through future annual budget updates and MYB cycles.
| Description | 2024 | 2025 | 2026 | 2027 | 2028 | 2029 | 2030 | 2031 | 2032 | 2033 | 2034 |
|---|---|---|---|---|---|---|---|---|---|---|---|
| Opening balance | 42.7 | (4.6) | (6.1) | (16.3) | (21.7) | (27.6) | (31.3) | (29.8) | (28.5) | (28.0) | (18.6) |
| Revenue from operating budget | 26.6 | 35.1 | 40.1 | 42.3 | 45.4 | 48.8 | 52.3 | 56.2 | 60.2 | 64.5 | 69.1 |
| Capital expenditures | (77.3) | (36.6) | (50.3) | (47.7) | (51.2) | (52.5) | (50.8) | (54.9) | (59.7) | (55.1) | (45.3) |
| Transfer from other reserve funds | 3.4 | n/a | n/a | n/a | n/a | n/a | n/a | n/a | n/a | n/a | n/a |
| Closing balance | (4.6) | (6.1) | (16.3) | (21.7) | (27.6) | (31.3) | (29.8) | (28.5) | (28.0) | (18.6) | 5.2 |
| Adopted closing balance | (10.6) | (20.6) | (35.9) | (75.1) | (118.6) | (131.3) | (143.8) | (154.2) | (131.0) | (128.0) | (194.1) |
| Change in balance through 2025 confirmed budget | 6.0 | 14.5 | 19.6 | 53.4 | 91.0 | 100.0 | 114.0 | 125.7 | 103.0 | 109.4 | 199.3 |
The annual transfers to the Library Capital and Police Capital reserve funds will be increased annually based on inflation. In the MYB materials, it was identified that an administrative adjustment was required between the City’s Infrastructure Renewal (150) reserve fund and the Library Capital (157) reserve fund. In 2023, the annual capital transfer to Library Capital (157) was increased to accommodate the future debt payments for the Baker Library; however, the debt payments will come out of the City’s Infrastructure Renewal (150) reserve fund. The Budget Companion Report includes a motion to move the funds transfer into Library Capital (157) in 2023 and 2024 to Infrastructure Renewal (150), and the transfers have been adjusted in 2025 and future to go into the correct reserve fund. The updated forecast, as shown in Table 58, includes the adjustments described above.
| Description | 2024 | 2025 | 2026 | 2027 | 2028 | 2029 | 2030 | 2031 | 2032 | 2033 | 2034 |
|---|---|---|---|---|---|---|---|---|---|---|---|
| Opening balance | 3.4 | 1.1 | 1.2 | 0.9 | 1.0 | 0.9 | 0.9 | 0.7 | 0.8 | 1.0 | 1.1 |
| Revenue from operating budget | 2.1 | 0.3 | 0.3 | 0.4 | 0.4 | 0.4 | 0.4 | 0.4 | 0.4 | 0.4 | 0.4 |
| Capital expenditures | (1.1) | (0.2) | (0.7) | (0.2) | (0.5) | (0.4) | (0.6) | (0.3) | (0.2) | (0.3) | (0.4) |
| Transfer to other reserve funds | (3.4) | n/a | n/a | n/a | n/a | n/a | n/a | n/a | n/a | n/a | n/a |
| Closing balance | 1.1 | 1.2 | 0.9 | 1.0 | 0.9 | 0.9 | 0.7 | 0.8 | 1.0 | 1.1 | 1.1 |
| Adopted closing balance | 4.5 | 6.6 | 8.2 | 10.4 | 12.4 | 14.7 | 16.8 | 19.3 | 22.0 | 24.8 | 28.0 |
| Change in balance through 2025 confirmed budget | (3.4) | (5.4) | (7.3) | (9.4) | (11.5) | (13.8) | (16.1) | (18.5) | (21.0) | (23.7) | (26.9) |
Rate-supported Infrastructure Renewal Strategy funding
The Infrastructure Renewal Strategy provides rate-supported funding through annual transfers to the respective reserve funds for the following services:
- parking;
- water;
- wastewater; and
- stormwater.
Parking
The Infrastructure Renewal Strategy for parking is through an annual transfer from Parking revenues to the Parking Capital reserve fund (151).
Through previous budgets, Council approved tax support to fund Parking operations of $1.1 million annually. The Parking operating budget also includes an annual transfer to the Parking Capital reserve fund (151). To prioritize work to be funded through the Service Enhancement Strategy, such as Transit and Active Transportation, the tax supported funding for Parking operations was reduced by roughly half, or $528 thousand. An equal amount was reduced from the annual transfer to the Parking Capital reserve fund (151). A summary of the annual capital funding transfers are in Table 59.
| Description | 2024 | 2025 | 2026 | 2027 | 2028 |
|---|---|---|---|---|---|
| Updated capital funding transfers from operating budget | 2.5 | 2.4 | 2.5 | 2.5 | 2.5 |
| Adopted capital transfers from operating budget | 2.4 | 3.0 | 2.9 | 3.0 | 3.1 |
| Change in transfers from operating through 2025 confirmed budget | 0.1 | (0.6) | (0.4) | (0.5) | (0.6) |
A summary of the reserve fund forecast is provided in Table 60 below. The reserve fund still builds up over the duration of the capital budget and forecast based on the planned capital works from 2025 through 2034; it also provides a source of funds for potential parking partnership opportunities that may arise, and for major replacement/renewal work on the City’s parkades planned beyond the 10-year forecast.
| Description | 2024 | 2025 | 2026 | 2027 | 2028 | 2029 | 2030 | 2031 | 2032 | 2033 | 2034 |
|---|---|---|---|---|---|---|---|---|---|---|---|
| Opening balance | 5.4 | 6.3 | 7.0 | 7.9 | 8.5 | 9.0 | 9.6 | 10.0 | 10.6 | 11.1 | 11.8 |
| Revenue from operating budget | 2.4 | 2.5 | 2.4 | 2.5 | 2.5 | 2.5 | 2.5 | 2.5 | 2.5 | 2.5 | 2.5 |
| Capital expenditures | (1.6) | (1.7) | (1.5) | (1.9) | (1.9) | (1.9) | (2.1) | (1.9) | (1.9) | (1.8) | (1.9) |
| Closing balance | 6.3 | 7.0 | 7.9 | 8.5 | 9.0 | 9.6 | 10.0 | 10.6 | 11.1 | 11.8 | 12.4 |
| Adopted closing balance | 7.4 | 8.8 | 9.8 | 10.8 | 9.6 | 11.0 | 11.9 | 13.6 | 15.2 | 17.4 | (15.3) |
| Change in balance through the 2025 confirmed budget | (1.1) | (1.8) | (1.9) | (2.3) | (0.6) | (1.4) | (1.9) | (3.0) | (4.1) | (5.6) | 27.7 |
Utility (water, wastewater and storm water) rate supported services
Funding for both the Infrastructure Renewal Strategy and Growth Strategy is transferred to each of the Water Capital (152), Wastewater Capital (153) and Stormwater Capital (165) reserve funds. The following tables show the transfers to Water Capital, Wastewater Capital, and Stormwater Capital reserve funds for both the Infrastructure Renewal Strategy and the Growth Strategy. The corresponding reserve fund forecast is also provided for each service.
As shown in Table 61 below, the Water Capital reserve fund (152) is in a deficit position beyond 2026 for the duration of the 10-year forecast. As shown in Table 62, the Wastewater Capital reserve fund (153) is in a positive position through the 10-year forecast and beyond. The overall combined surplus in these two reserve funds is the result of the capital prioritization work. As noted above, several integrated corridor reconstruction projects were deferred to balance the tax-supported capital reserve funds. Completing additional Transportation Network projects is limited by the availability of tax-supported funding to move these integrated projects forward. Additional service-specific projects for water and wastewater were also deferred as part of prioritization. Staff have made a recommendation to Council in the Budget Companion Report to provide direction to investigate the customer impact of adjusting these two utility rates with the objective of eliminating the deficit in the Water Capital reserve fund (152) and reducing the positive balance in the Wastewater Capital reserve fund (153). As part of this work, staff will also determine whether there is an opportunity to bring back any of the deferred service-specific capital projects that do not have any property tax funding attached, if there is a strong business case for doing so. Adjustments resulting from this work will be proposed through the 2026 budget update .
| Description | 2024 | 2025 | 2026 | 2027 | 2028 | 2029 | 2030 | 2031 | 2032 | 2033 | 2034 |
|---|---|---|---|---|---|---|---|---|---|---|---|
| Opening balance | 45.3 | 12.1 | 10.4 | 3.6 | (17.5) | (29.0) | (29.8) | (41.1) | (34.6) | (76.7) | (65.7) |
| Revenue from operating budget | 18.7 | 21.5 | 24.8 | 28.6 | 31.5 | 34.3 | 37.4 | 40.8 | 44.4 | 48.4 | 50.5 |
| Capital expenditures | (49.2) | (19.9) | (28.0) | (46.4) | (39.7) | (31.8) | (45.4) | (31.9) | (83.6) | (34.4) | (27.3) |
| Transfer to other reserve funds | (2.7) | (3.4) | (3.6) | (3.3) | (3.3) | (3.3) | (3.3) | (2.3) | (3.0) | (3.0) | (2.2) |
| Closing balance | 12.1 | 10.4 | 3.6 | (17.5) | (29.0) | (29.8) | (41.1) | (34.6) | (76.7) | (65.7) | (44.7) |
| Adopted closing balance | (6.3) | (15.7) | (15.2) | (19.6) | (50.0) | (76.1) | (111.4) | (181.9) | (187.0) | (188.2) | (196.2) |
| Change in balance through the 2025 confirmed budget | 18.4 | 26.1 | 18.8 | 2.1 | 21.0 | 46.3 | 70.3 | 147.3 | 110.3 | 122.5 | 151.5 |
| Description | 2024 | 2025 | 2026 | 2027 | 2028 | 2029 | 2030 | 2031 | 2032 | 2033 | 2034 |
|---|---|---|---|---|---|---|---|---|---|---|---|
| Opening balance | 105.4 | 74.1 | 77.2 | 35.2 | 28.8 | 41.2 | 60.2 | 75.0 | 98.5 | 115.3 | 136.1 |
| Revenue from operating budget | 17.5 | 20.4 | 23.5 | 27.7 | 30.4 | 32.8 | 35.5 | 37.4 | 40.5 | 43.9 | 47.6 |
| Capital expenditures | (46.7) | (14.7) | (62.7) | (31.5) | (15.4) | (11.3) | (18.0) | (12.2) | (21.4) | (20.8) | (13.4) |
| Transfer to other reserve funds | (2.1) | (2.6) | (2.8) | (2.6) | (2.6) | (2.6) | (2.6) | (1.8) | (2.3) | (2.3) | (1.7) |
| Closing balance | 74.1 | 77.2 | 35.2 | 28.8 | 41.2 | 60.2 | 75.0 | 98.5 | 115.3 | 136.1 | 168.6 |
| Adopted closing balance | 56.4 | 52.8 | 3.4 | 15.5 | 9.7 | 20.6 | 21.3 | 28.3 | 14.6 | 27.5 | 21.0 |
| Change in balance through the 2025 confirmed budget | 17.7 | 24.4 | 31.8 | 13.3 | 31.5 | 39.6 | 53.7 | 70.2 | 100.7 | 108.6 | 147.6 |
As shown in Table 63, the Stormwater Capital reserve fund has a positive balance in 2034, which indicates the capital budget for stormwater-related work is achievable over the long-term with the projected funding envelope.
| Description | 2024 | 2025 | 2026 | 2027 | 2028 | 2029 | 2030 | 2031 | 2032 | 2033 | 2034 |
|---|---|---|---|---|---|---|---|---|---|---|---|
| Opening balance | 19.9 | 10.2 | 14.0 | 12.1 | 2.7 | (0.8) | (10.1) | (12.8) | (8.4) | (11.7) | (6.4) |
| Revenue from operating budget | 10.1 | 12.1 | 13.7 | 15.6 | 16.9 | 18.2 | 19.7 | 21.2 | 24.0 | 27.0 | 30.5 |
| Capital expenditures | (19.6) | (8.1) | (15.3) | (24.8) | (20.1) | (27.3) | (22.2) | (16.7) | (27.0) | (21.5) | (8.0) |
| Transfer to other reserve funds | (0.2) | (0.2) | (0.2) | (0.2) | (0.2) | (0.2) | (0.2) | (0.1) | (0.2) | (0.2) | (0.1) |
| Closing balance | 10.2 | 14.0 | 12.1 | 2.7 | (0.8) | (10.1) | (12.8) | (8.4) | (11.7) | (6.4) | 16.0 |
| Adopted closing balance | 4.7 | 2.4 | 1.6 | 6.7 | (45.7) | (58.5) | (85.9) | (95.2) | (124.7) | (127.4) | (125.2) |
| Change in balance through the 2025 confirmed budget | 5.5 | 11.6 | 10.5 | (4.0) | 44.9 | 48.4 | 73.1 | 86.8 | 113.0 | 121.0 | 141.2 |
Growth Strategy
The purpose of the Growth Strategy is to fund growth-related costs. The City uses growth-related revenues to pay for the costs of growth to the extent allowed by legislation. Growth revenues used to pay for growth-related capital expenses are collected from:
- Cash-in-lieu of parkland dedication;
- Community benefit charges;
- Development charges;
- Property tax assessment growth; and
- Utility rate revenue growth.
Development charges
Development charges (DCs) are the largest funding source for growth-related capital. The City’s current DC bylaws, (2024)-20866 through (2024)-20880, were passed in January 2024. As part of that process, new DC rates were calculated and approved as part of the 2023 Development Charges Background Study dated January 26, 2024 and were used during the development of the 2024-2027 multi-year budget.
Development charges are generally collected at the time of building permit. Roads, water, wastewater and stormwater infrastructure is funded through development charges, and needs to be in place in advance of housing development occurring. Additionally, the timing of collection of development charges fluctuates with building activity. These factors can result in a mismatch in timing between the costs and revenue. As a result, debt financing may be needed to bridge the timing gap, and debt capacity of $234.3 million has been reserved for DC-funded infrastructure over the 10-year capital budget and forecast period.
The City is also in the process of developing a policy for the use of Municipal Servicing and Financing Agreements (commonly referred to as front-end financing) to accelerate growth related infrastructure more quickly than the City would otherwise have the fiscal capacity for.
Table 64 presents a forecast of the consolidated DC year-end reserve fund balances based on the growth-related capital projects included in the prioritized 10-year capital budget and forecast. These balances are net of project-specific debt approved in prior capital budgets, but do not reflect the debt capacity earmarked for DC projects as outlined in the Debt Strategy.
| Reserve fund grouping | 2024 | 2025 | 2026 | 2027 | 2028 | 2029 | 2030 | 2031 | 2032 | 2033 | 2034 |
|---|---|---|---|---|---|---|---|---|---|---|---|
| Parkland dedication | 18.5 | 17.8 | 18.3 | 19.1 | 19.9 | 20.7 | 21.4 | (3.7) | (3.3) | (2.8) | (2.3) |
| Community benefit charges | 1.4 | 1.7 | 2.0 | 2.5 | 2.9 | 3.4 | 3.9 | 2.2 | 2.6 | 3.0 | 3.4 |
| Development charges | 33.7 | 67.5 | (1.1) | (20.9) | 2.3 | 43.4 | 81.4 | 97.4 | 60.2 | 104.5 | 117.1 |
In the prioritized capital budget and forecast, the DC reserve funds as a group are projected to remain positive, with the exception of 2026 and 2027 – two years when significant water, wastewater, and public works projects are budgeted.
While there is a healthy positive balance projected in the DC reserve funds by the end of the forecast period, DCs are a highly volatile revenue stream and are subject to economic and market conditions. Staff will continue to monitor balances closely, and report on collections through the quarterly budget monitoring reports. Lower than budgeted DC collections may result in the deferral of projects, activating front end agreements or use of the reserved debt capacity later in the 10-year forecast to bridge cash flows. Staff will consider if additional growth projects can be accommodated in the later part of the 10-year forecast depending on actual collection experience.
Some capital costs associated with growth are not eligible to be funded through a specific growth revenue funding stream: most notably, solid waste non-diversion and parking capital costs. Additionally, growth studies were removed as DC eligible costs through Bill 23 and shifted to a property tax and utility rate burden. However, in June 2024, the provincial government passed Bill 185 which added growth studies back in as a DC eligible cost. Municipalities that had updated their DC study between Bill 23 and Bill 185 were given six months to approve a DC update to add growth studies back into the DC. Guelph Council approved the DC Bylaw amendment on November 13 which added growth studies back. This amendment is expected to result in a $7.2 million increase in tax supported capital reserve funds and an $8.9 million increase in non-tax supported capital reserve funds, with an associated decrease in the DC reserve funds. These changes will be reflected in the reserve fund forecasts in the 2026 Budget Update.
Tax-supported revenues
As noted above, some growth-related costs are not eligible for funding through dedicated growth revenue streams. Additionally, development charge exemptions and discounts are required to be funded through other sources: property taxes for tax supported services, and utility rates for rate supported services.
They City maintains the tax-supported Growth reserve fund (156) to fund non-DC eligible growth capital costs, and exemptions and discounts for tax supported services. In addition to adding growth studies back into eligibility, Bill 185 removed the mandatory phase-in of new DC rates that provided a 20 per cent discount in year one, 15 per cent discount in year two, 10 per cent discount in year three, and five per cent discount in year four. These changes are positive for the Growth reserve fund (156) balance forecast. However, at the same time that Bill 185 was passed, the Province enacted the affordable housing exemptions that had been introduced through Bill 23, which will negatively impact the forecasted Growth reserve fund (156) balance as well as the utility rate capital reserve funds.
The reserve forecast for Growth reserve fund (156) has been updated to remove the impact from the mandatory phase-in, and add in an estimate of the cost of affordable housing exemptions, assuming that affordable units are created at the same rate as the average of the past five years. Further adjustments to replace tax supported funding with DC funding for growth studies will be processed when the DC update is approved in November. Transfers into the Growth Reserve Fund (156) have remained consistent with the 2024–2027 Multi-Year Budget, as shown in Table 65, and the projected balance continues to be negative throughout the forecast period. Like DC collections, costs for DC exemptions are dependent on the timing of eligible building activity and will fluctuate. Actual exemptions will continue to be monitored closely, and reported on through the quarterly budget monitoring reports.
The 2025 transfer from operating budget includes a one-time transfer of $424 thousand for an expected increase in assessment growth in 2025. This additional assessment growth revenue is being directed to the Growth reserve fund in accordance with Council approved policy.
The budget for Beaumont Park was amended by Council to be advanced to 2025 and 2026. The impact of this is being offset by an increased transfer to the growth reserve fund in the same years.
| Description | 2024 | 2025 | 2026 | 2027 | 2028 |
|---|---|---|---|---|---|
| Confirmed transfer from operating budget | 5.8 | 8.1 | 9.9 | 10.6 | 10.8 |
| Adopted transfer from operating budget | 5.8 | 7.5 | 9.0 | 10.5 | 10.8 |
| Change in transfers from operating budget | 0.0 | 0.6 | 0.9 | 0.1 | 0.0 |
As shown in Table 66, the Growth reserve fund is expected to be in a deficit position for the 10-year forecast. The pace of exemption and discount eligible development in the City will inform the actual amount to be transferred from Growth reserve fund (156) to the DC reserve funds annually.
| Description | 2024 | 2025 | 2026 | 2027 | 2028 | 2029 | 2030 | 2031 | 2032 | 2033 | 2034 |
|---|---|---|---|---|---|---|---|---|---|---|---|
| Opening balance | 0.2 | (5.1) | (8.7) | (11.4) | (11.9) | (13.5) | (14.8) | (16.1) | (11.9) | (11.2) | (9.7) |
| Transfers from operating | 5.8 | 8.1 | 9.9 | 10.6 | 10.8 | 11.2 | 11.5 | 11.8 | 12.2 | 12.6 | 12.9 |
| Capital expenditures | (2.4) | (0.9) | (1.0) | (0.3) | (1.7) | (1.8) | (2.1) | (0.5) | (2.3) | (1.9) | (0.4) |
| Transfer to other reserve funds | (8.8) | (10.8) | (11.6) | (10.7) | (10.7) | (10.7) | (10.7) | (7.1) | (9.2) | (9.2) | (7.1) |
| Closing balance | (5.1) | (8.7) | (11.4) | (11.9) | (13.5) | (14.8) | (16.1) | (11.9) | (11.2) | (9.7) | (4.3) |
| Adopted closing balance | (12.6) | (20.9) | (26.5) | (27.1) | (26.5) | (26.8) | (23.9) | (18.3) | (15.0) | (10.9) | (3.7) |
| Change in balance | 7.5 | 12.2 | 15.1 | 15.2 | 13.0 | 12.0 | 7.8 | 6.4 | 3.8 | 1.2 | (0.6) |
Service Enhancement Strategy
The Service Enhancement Strategy supports investments to advance Council’s strategic plan and approved service delivery master plans to increase service levels for the community. This strategy is funded from property taxes through an annual transfer from the operating budget to the Service Enhancement reserve fund (159). The funding transfer consists of a recurring portion as well as time-limited transfers earmarked for specific purposes.
The strategy currently funds projects in the following categories:
- Baker District
- Active transportation network including the Cycling Master Plan
- City facilities and other corporate plans and initiatives
- Guelph Trail Master Plan, Urban Forest Management Plan, and open spaces
- Investment in digital services and customer service
- Transit Route Review and other service enhancements
- Downtown Streetscaping
- Solid Waste Management Master Plan recommendations
As outlined in the Funding Strategy Overview section, the overall capital funding envelope was reduced for the 2025 confirmed budget. To continue to prioritize transfers into the tax-supported Infrastructure Renewal and Growth Strategies, the Service Enhancement recurring funding was reduced in 2025 and 2026. This is a change from the adopted multi-year budget (MYB), in which the recurring transfers were forecasted to continue increasing over these years. The total funding provided in the strategy is significantly reduced, and the Service Enhancement Reserve Fund is projected to have a negative balance until 2034 based on the capital projects included in the updated capital budget that are funded from this source.
As discussed in the Infrastructure Renewal Strategy, in 2025, the impacts of the reduction to tax-supported capital transfers were partially offset by a $528 thousand reduction in tax support for Parking, and this funding was moved to the Service Enhancement Strategy to directly support the execution of more work in the Active Transportation Network and Transit categories. Beyond 2027, funding increases by inflation plus $550 thousand annually to provide funding for the prioritized capital budget. This plan will return this reserve fund to a positive balance by 2034. Between 2025 and 2033, this strategy relies on inter-reserve fund borrowing to manage through the negative projected available balances after commitments.
The time-limited transfer for the Service Enhancement strategy relates to phasing in operating costs of the Baker District and the South End Community Centre. Given the significant operating costs associated with the new facilities, the phase-in gradually adds the costs to the tax levy or rates. To reduce the impact on the 2025 tax levy, the phase-in transfer was reduced by $228 thousand rather than continuing to increase the transfer. This will result in a higher impact on the tax levy timed with the facility opening in 2026.
Table 67 shows the annual time-limited and recurring transfers to the Service Enhancement Strategy in comparison with the adopted budget.
| Description | 2024 | 2025 | 2026 | 2027 | 2028 |
|---|---|---|---|---|---|
| Updated time-limited transfer | 2.1 | 1.9 | 0.5 | 0.0 | 0.0 |
| Updated recurring transfer | 5.9 | 5.4 | 4.7 | 5.3 | 6.0 |
| Total updated transfer | 8.0 | 7.3 | 5.3 | 5.3 | 6.0 |
| Adopted time-limited transfer | 2.1 | 3.5 | 0.0 | 0.0 | 0.0 |
| Adopted recurring transfer | 5.9 | 6.3 | 7.3 | 8.2 | 9.0 |
| Total adopted transfer | 8.0 | 9.8 | 7.3 | 8.2 | 9.0 |
| Change in transfer from operating budget to reserve fund | 0.0 | (2.5) | (2.0) | (2.9) | (3.0) |
Table 68 is the list of capital projects that are funded by the Service Enhancement (159) reserve fund and the amount of service enhancement funding in the project. This is not the total project cost, but the service enhancement portion of the costs.
| Project | 2025 | 2026 | 2027 | 2028 |
|---|---|---|---|---|
| CT0005 Market Square Equipment Upgrade | 0.1 | 0.0 | 0.0 | 0.0 |
| FS0099 Firefighter Survival Trailer | 0.1 | 0.0 | 0.0 | 0.0 |
| GG0266 Corporate Project, Program and Portfolio Management | 0.1 | 0.1 | 0.1 | 0.1 |
| GG0269 Accessibility Improvements | 0.2 | 0.2 | 0.2 | 0.2 |
| GG0283 Corporate Project Management Improvement Initiatives | 0.0 | 0.1 | 0.1 | 0.1 |
| GG0284 Decision Support System Acquisition and Implementation | 0.0 | 0.0 | 0.0 | 0.5 |
| IT0061 Fibre Data Connection | 0.1 | 0.1 | 0.6 | 0.1 |
| IT0118 Cyber Security Program of Work | 0.1 | 0.0 | 0.1 | 0.0 |
| PK0224 Woolwich to Woodlawn Multi-Use Trail Construction | 0.8 | 0.0 | 0.0 | 0.0 |
| PL0078 Urban Design Guidelines | 0.0 | 0.0 | 0.0 | 0.1 |
| PN0041 Macdonell St Reconstruction – Norfolk to Wellington | 0.0 | 0.1 | 0.1 | 0.3 |
| PN0060 Wyndham St N Reconstruction – Farquhar to Woolwich | 0.6 | 0.2 | 0.0 | 0.0 |
| PN0082 Exhibition Ph1: Royal Recreational Trail – Exhibition to Woolwich | 0.0 | 0.2 | 0.0 | 0.0 |
| PN0083 Exhibition Ph2: Exhibition & London St Reconstruction – Yorkshire to Verney | 0.0 | 0.0 | 0.0 | 0.1 |
| PO0033 Recreation Trails Renewal – Active Transportation | 0.0 | 0.2 | 0.1 | 0.5 |
| RD0330 Emma / Earl Pedestrian Bridge | 0.1 | 0.0 | 0.0 | 0.0 |
| RD0377 Gordon Street Phase 2 – Waterloo to College (ICIP-GUE-05) | 0.0 | 0.0 | 0.0 | 0.0 |
| RD0378 Eramosa Rd protected bike lanes (ICIP-GUE-05) | 0.0 | 0.0 | 0.0 | 0.1 |
| RD0385 Cycling Master Plan Implementation | 0.1 | 0.4 | 0.4 | 0.4 |
| RD0392 Sustainable Transportation Programs | 0.1 | 0.1 | 0.1 | 0.1 |
| RD0465 TMP-Quality Transit Network Implementation | 0.0 | 0.5 | 0.0 | 0.0 |
| RD0469 Gordon Street Phase 1- Waterloo to College (ICIP-GUE-05) | 0.0 | 0.0 | 0.0 | 0.1 |
| RD0476 Active Transportation | 0.0 | 0.1 | 0.1 | 0.1 |
| SS0030 St. Georges Square Self Cleaning Washroom | 0.0 | 0.0 | 0.3 | 0.0 |
| TC0043 Bus Shelter Purchase | 0.2 | 0.2 | 0.2 | 0.2 |
| TC0094 Conestoga Route Requirements | 2.8 | 0.0 | 0.0 | 0.0 |
| TC0095 New/Upgrades to IT Software – Transit | 0.4 | 0.2 | 0.0 | 0.0 |
| TF0032 Accessible Pedestrian Signals | 0.1 | 0.1 | 0.1 | 0.1 |
| TM0010 Mobility Van – Growth | 0.0 | 0.1 | 0.1 | 0.0 |
| WC0043 Solid Waste Management Masterplan, Assessments, Studies and Policy Development. | 0.1 | 0.0 | 0.1 | 0.4 |
| WC0044 Solid Waste Management Master Plan Environmental Programs Implementation and Subsidies | 0.2 | 0.0 | 0.2 | 0.4 |
| WC0057 Downtown Public Space Waste Containers | 0.5 | 0.0 | 0.2 | 0.0 |
| Projects added through the Mayor’s update to the budget | 0.1 | 0.0 | 0.0 | 0.0 |
| Total | 6.5 | 2.7 | 2.9 | 3.6 |
In addition to directly funding capital projects, debt principal and interest payments for the service enhancement portion of projects that have debt financing attached to them will come out of the reserve fund over time.
Table 69 estimates debt payments over the 10-year forecast that will be paid out of the Service Enhancement reserve fund.
| Description | 2024 | 2025 | 2026 | 2027 | 2028 | 2029 | 2030 | 2031 | 2032 | 2033 | 2034 |
|---|---|---|---|---|---|---|---|---|---|---|---|
| Baker District debt payments | 0.0 | 0.0 | 0.8 | 2.2 | 2.8 | 2.8 | 2.8 | 2.8 | 2.8 | 2.8 | 2.8 |
| Downtown Streetscaping debt payments | 0.0 | 0.0 | 0.0 | 0.0 | 0.0 | 0.4 | 1.3 | 1.3 | 1.3 | 1.3 | 1.3 |
| Total debt payments | 0.0 | 0.0 | 0.8 | 2.2 | 2.8 | 3.2 | 4.1 | 4.1 | 4.1 | 4.1 | 4.1 |
Table 70 details the reserve fund forecast for the Service Enhancement (159) reserve fund. The balance in the reserve fund is expected to be lower throughout the 10-year forecast in comparison to the adopted budget. This change is due to a reduction in the funding going into the strategy and an increase in the costs that the strategy is funding. While many Service Enhancement projects were deferred through the capital budget prioritization, downtown streetscaping and downtown public space containers were added to the capital budget.
| Description | 2024 | 2025 | 2026 | 2027 | 2028 | 2029 | 2030 | 2031 | 2032 | 2033 | 2034 |
|---|---|---|---|---|---|---|---|---|---|---|---|
| Opening balance | (2.1) | (4.7) | (4.0) | (2.3) | (2.3) | (2.9) | (5.3) | (4.7) | (4.1) | (1.9) | (4.0) |
| Revenue from operating budget | 8.0 | 7.3 | 5.3 | 5.3 | 6.0 | 6.7 | 7.5 | 8.2 | 9.0 | 9.9 | 10.7 |
| Capital expenditures | (10.5) | (6.6) | (3.6) | (5.3) | (6.5) | (9.2) | (6.9) | (7.7) | (6.8) | (12.0) | (6.0) |
| Closing balance | (4.7) | (4.0) | (2.3) | (2.3) | (2.9) | (5.3) | (4.7) | (4.1) | (1.9) | (4.0) | 0.7 |
| Adopted closing balance | (3.8) | 2.0 | 3.5 | 4.6 | 0.4 | (1.6) | 0.2 | 3.8 | 7.1 | 8.8 | 8.9 |
| Change in balance through the 2025 confirmed budget | (0.9) | (6.0) | (5.8) | (6.9) | (3.3) | (3.7) | (4.9) | (7.9) | (9.0) | (12.8) | (8.2) |
Brownfield Renewal Strategy
The Brownfield Renewal Strategy funds activities required to monitor and clean up environmental contamination at City-owned sites. The strategy funds projects related to monitoring, investigation, and risk assessment in addition to site remediation. As noted in the budget manual, the goal of this strategy is to reduce the contaminated sites liability to less than $5 million over the next 10 to 25 years.
In the updated budget, transfers into the Brownfield Renewal reserve fund (155) were reduced by $3 million in 2025, and re-set at a level of $0.3 million annually beginning in 2025, as shown in Table 71. This reduction in the transfer to the reserve fund has provided relief to the tax levy and utility rates, and has better aligned the amount going into the reserve fund with the costs projected to be incurred. The new level of funding provides for continued advancement of the City’s contaminated site program including historical landfill properties and the Fountain Street parking lot, while lower priority contaminated site investigation and management work that is not required for regulatory obligations has been deferred. The uncommitted reserve fund balance provides a buffer for managing unexpected costs arising from investigations.
| Description | 2024 | 2025 | 2026 | 2027 | 2028 |
|---|---|---|---|---|---|
| Updated transfers from operating budget | 3.2 | 0.3 | 0.3 | 0.3 | 0.3 |
| Adopted transfers from operating budget | 3.2 | 3.3 | 3.3 | 3.4 | 3.5 |
| Change in transfers from operating budget | (0.0) | (3.0) | (3.0) | (3.1) | (3.2) |
The value of the liability for contaminated sites as of the end of 2023 was $26.4 million, in addition to the $4.1 million landfill obligation now included in the asset retirement obligation liability. Progress toward reducing this liability is expected to continue within the 10-year forecast, and further resources will be required to clean-up known City-owned contaminated sites. Table 72 outlines the projected balance in the reserve fund over the 10-year forecast.
| Description | 2024 | 2025 | 2026 | 2027 | 2028 | 2029 | 2030 | 2031 | 2032 | 2033 | 2034 |
|---|---|---|---|---|---|---|---|---|---|---|---|
| Opening balance | 14.2 | 7.7 | 8.0 | 8.0 | 8.0 | 7.3 | 7.1 | 6.9 | 6.7 | 6.6 | 6.4 |
| Revenue from operating budget | 3.2 | 0.3 | 0.3 | 0.3 | 0.3 | 0.3 | 0.3 | 0.3 | 0.3 | 0.3 | 0.3 |
| Capital expenditures | (9.7) | n/a | (0.3) | (0.3) | (1.0) | (0.4) | (0.4) | (0.5) | (0.4) | (0.4) | (0.3) |
| Closing balance | 7.7 | 8.0 | 8.0 | 8.0 | 7.3 | 7.1 | 6.9 | 6.7 | 6.6 | 6.4 | 6.4 |
| Adopted closing balance | 7.4 | 10.0 | 11.9 | 14.0 | 16.4 | 19.6 | 22.8 | 26.3 | 29.8 | 32.6 | 36.4 |
| Change in balance through 2025 confirmed budget | 0.3 | (2.0) | (4.0) | (6.0) | (9.1) | (12.5) | (15.9) | (19.6) | (23.2) | (26.2) | (30.0) |
100 Per Cent Renewable Energy (100RE) Strategy
The 100 per cent Renewable Energy (100RE) strategy funds projects that reduce emissions and support Guelph’s Race-to-Zero goal to become a net-zero carbon community by 2050.
An overview of focus projects for City emissions reductions, as well as City supports for community-led reductions, was outlined in Information Report 2022-223 – Cities Race-to-Zero Four-Year Interim Targets published in June 2022.
In the adopted multi-year budget, transfers to the 100RE reserve fund were expected to total $38.2 million between 2024 and 2028, and reach an annual transfer of $11.4 million by 2028. This demonstrated a significant increase in the investment in this strategy. As part of the reduction to tax supported capital transfers proposed through the 2025 budget update, transfers to the 100RE reserve fund (355) were reduced and are now forecasted to total $22 million from 2024 to 2028, with the annual transfer at $5.6 million by 2028, as shown in Table 73 below. This reduces the capacity for capital spending on the 100RE and Race-to-Zero goals. The proposed updated strategy returns the 100RE reserve fund (355) to a positive balance in 2034. Between 2025 and 2033, this strategy relies on inter-reserve fund borrowing to manage through the negative projected available balances after commitments.
| Description | 2024 | 2025 | 2026 | 2027 | 2028 |
|---|---|---|---|---|---|
| Confirmed transfers from operating budget | 3.4 | 5.4 | 4.2 | 4.3 | 5.6 |
| Adopted transfers from operating budget | 3.4 | 5.5 | 7.8 | 10.1 | 11.4 |
| Change in transfers from operating budget | 0.0 | (0.1) | (3.6) | (5.8) | (5.8) |
Below are the categories of projects that advance the City’s emissions reductions Table 74.
| Projects | Capital project number | Project status | Estimated emissions reduction |
|---|---|---|---|
| Guelph Transit electrification | TC0059 TC0064 TC0070 TC0077 TC0090 | Executing | 6,700 tCO2e |
| Anaerobic digestion upgrades at Organic Waste Processing Facility to produce renewable natural gas | WC0048 | Deferred beyond 10-year capital budget | 3,000 to 5,000 tCO2e |
| Water Resource Recovery Centre upgrade to produce renewable natural gas (rate funded) | ST0009 | Deferred beyond 10-year capital budget | 2,000 to 3,000 tCO2e |
| 100RE initiatives – pooled funding | GG0261 | Executing | Varies by project. |
Through the capital budget prioritization, some projects from this strategy were deferred beyond the 10-year capital budget or the pace of investment was slowed. The reduction in funding for this strategy overall will mean that there will be less financial capacity to advance future projects that are at the research phase. This will impact the City’s ability to meet the short- and long-term 100RE and Race-to-Zero goals. Staff will continue to build and evaluate the business cases for large-scale projects and actively consider other funding opportunities where possible. Table 75 presents the projects that are funded through the 100RE strategy in 2025 through 2028. These projects are all part of the electrification of Guelph Transit and will contribute to reducing the City’s emissions.
| Project | 2025 | 2026 | 2027 | 2028 |
|---|---|---|---|---|
| G0261 100RE Initiatives | 1.0 | 1.2 | 1.2 | 1.7 |
| TC0059 Guelph Transit and Fleet Services Facility (ICIP-GUE-03) | 0.0 | 0.0 | 0.0 | 1.9 |
| TC0064-012 Route Review – Year 5 (ICIP-GUE-01) | 0.9 | 0.0 | 0.0 | 0.0 |
| TC0064-013 Route Review – Year 6 (ICIP-GUE-01) | 0.0 | 1.2 | 0.0 | 0.0 |
| TC0064-014 Route Review – Year 7 (ICIP-GUE-01) | 0.0 | 0.0 | 1.0 | 0.0 |
| TC0064-015 Route Review – Year 8 (ICIP-GUE-01) | 0.0 | 0.0 | 0.0 | 1.1 |
| TC0070 Bus Electrification – Replacement (ICIP-GUE-04) | 2.5 | 2.6 | 0.2 | 0.0 |
| TC0077 Transit Bus Replacement – w/ Electric | 0.0 | 0.0 | 0.0 | 3.0 |
| TC0090 Guelph Transit Central Station Electric Bus Charging | 0.0 | 5.0 | 0.0 | 0.0 |
| Total | 4.4 | 9.9 | 2.3 | 7.7 |
Through the multi-year budget, a $5.8 million deficit was projected in the 100RE reserve fund by 2034. The updated projection for the 100RE reserve fund is a $0.5 million positive balance after 10 years as shown in Table 76. Staff will continue to explore and pursue grant opportunities to improve the overall status of the reserve fund and, if possible, move forward projects that were deferred to achieve balanced funding by 2034.
| Description | 2024 | 2025 | 2026 | 2027 | 2028 | 2029 | 2030 | 2031 | 2032 | 2033 | 2034 |
|---|---|---|---|---|---|---|---|---|---|---|---|
| Opening balance | 6.6 | (1.7) | (0.8) | (6.5) | (4.5) | (6.6) | (5.6) | (3.0) | (3.9) | (2.9) | (1.1) |
| Transfers from operating | 3.4 | 5.4 | 4.2 | 4.3 | 5.6 | 6.4 | 7.3 | 8.2 | 9.1 | 10.0 | 11.0 |
| Capital expenditures | (11.7) | (4.4) | (9.9) | (2.3) | (7.7) | (5.4) | (4.7) | (9.0) | (8.1) | (8.2) | (8.3) |
| Closing balance | (1.7) | (0.8) | (6.5) | (4.5) | (6.6) | (5.6) | (3.0) | (3.9) | (2.9) | (1.1) | 1.6 |
| Adopted closing balance | (0.6) | (0.2) | (7.8) | (4.1) | (11.3) | (6.3) | (4.2) | (6.9) | (5.0) | (2.7) | (5.8) |
| Change in balance | (1.1) | (0.6) | 1.3 | (0.4) | 4.7 | 0.7 | 1.2 | 3.0 | 2.1 | 1.6 | 7.4 |
| 2025 confirmed budget |
|---|
| Council reports |
| Budget board |
Related pages
City budget
Previous annual budgets
Budget manual
Budget Policy
Watch and listen
Mayoral direction
Latest updates
Timeline
October 17: Guelph’s 2025 Budget Update released
October 30: Special Council – 2025 Budget Update
November 19: Special Council – 2025 budget Public delegations
November 27: Special Council – 2025 budget amendments
January 22: Special Council – 2025 budget local boards and shared services