Read Mayor Guthrie’s Introduction to the 2024-2027 Multi-Year Budget arrow_forward
Watch the 2024-2027 budget presentation arrow_forward
Accessibility information.
On this page
Budget summary
The 2024-2027 Multi-Year Budget (MYB) reflects the mayoral direction to staff to build a four-year budget to meet our service delivery requirements to both our current and future population, in alignment with the Future Guelph strategic plan.
The operating and capital budget investment is focused on:
- taking care of what we own,
- maintaining service delivery to our current and growing population,
- balancing the funding needs of the City’s local boards and shared service agencies,
- meeting service enhancement commitments from prior Council decisions, and
- replacing provincially regulated development charge revenue losses needed to pay for housing-enabling infrastructure.
Beyond this, the budget is also managing the steadily rising inflation at above average rates since 2021.
Guelph is mandated to grow and has pledged to build 18,000 homes by 2031. The 2024-2027 MYB reflects the necessary investments to support the full housing spectrum, including enabling growth and then servicing growth. Before houses, apartments, shopping centres, offices, and industrial parks are built, the City must build the water, wastewater, stormwater, and roads infrastructure to support it.
Once built, the additional population and businesses need emergency services; transit must be expanded to help people move freely, and parks and recreation, library, and other services must grow to serve this larger population and support a high quality of life.
We also must continue to care for the infrastructure we already have (infrastructure renewal), which the Guelph community relies on daily.
These competing impacts of growth layered with the economic factors, decisions from other levels of government and Council’s vision for Future Guelph are the overriding themes reinforced through all aspects of the multi-year budget documents. This fiscal balancing has led to many tough decisions like capital project deferrals, extending the service life of assets, and drawing on the contingency reserves to a higher degree than in the past, as the City tries to balance affordability of taxes and user fees with meeting service delivery expectations and addressing the challenges the community is facing. The budget controls the pace of how fast we meet the vision as set out in Future Guelph after considering the entirety of the fiscal requirements. Guelph’s 2024-2027 MYB is a balanced approach to meeting the core business needs of the City.
Future Guelph strategic plan alignment
The key investments included in the Guelph’s MYB advance the strategic plan and align to the various initiatives as follows.
Foundations:
- Ensure that the City maintains pace with growth and provides a foundation of resources through investments in recruitment, labour relations and the appropriate administrative supports.
- Increase trust and transparency and reporting information with the design and development of a strategic plan performance measurement data hub and investments in corporate reporting and dashboards.
- Support good governance, best practices and encourage greater community participation with investments to support advisory committees of council.
- Development of a customer-focused service design framework and team to govern changes to public-facing City services achieves goals outline in the Service Simplified Strategy.
- Support a proactive approach in identifying and addressing issues and concerns from within the community related to equity, diversity and inclusion and the advancement of equitable access to City services, such as fee assistance programs.
- Investments into Information Technology provide the ability to advance the City’s digital infrastructure. Highlights of these investments include implementation of the Customer Relationship Management Strategy, enhanced cyber security programs of work and integration of platforms across the organization to deliver a comprehensive Enterprise Resource Planning system.
- Maintenance of the City’s healthy financial position through investment in financial accounting and monitoring resources and a continued focus on maintaining the condition and performance of City infrastructure.
City Building:
- Resourcing investments across Planning and Building Services, Engineering and Transportation Services, Environmental Services, Finance, Legal Services, and Strategy, Innovation and Intergovernmental Services enable the City to accelerate development applications that support affordable housing and, reduce development application and building permit approval timelines to increase overall housing supply as well as advance policy work that supports both housing and affordable housing initiatives.
- Tax and rate funded investment to replace lost development charge revenues as legislated by the province and enable continued investment in housing-enabling infrastructure to unlock new housing capacity in the City.
- Advancing technology in planning and building services processes that drive automation and efficiency to increase housing supply.
- Investment in Heritage Initiatives allows the City to preserve heritage lands and work towards the implementation of the Cultural Action Plan.
- Investment in the Guelph Transit and Fleet facility ensures the development of critical infrastructure that supports operation and maintenance of City fleet vehicles and transit electrification.
- Expansion of the red-light camera project enhances road safety and advances Vision Zero work.
- Investments in transit enable the City to advance the Guelph Transit Future Ready Action Plan which increase overall transit ridership.
- Investment in culture and recreation programs and people allows the City to keep pace with growth, creates vibrant spaces through culture for the community and supports the implementation of the parks and recreation master plan.
- Investment for resources in parks enables the City to deliver on action items in the parks and recreation master plan and also offers improved service delivery to the community.
Environment:
- Facility renewals are focused on energy conservation and reduction of greenhouse gases
- Investments in 100RE initiatives enable the City to reduce corporate greenhouse gas emissions and increase energy efficiency.
- Investments in the Urban Forest Management Plan and resourcing advance the City’s effort in implementing the third phase of the plan to increase Guelph’s tree canopy coverage.
- Investment in fleet replacements that reduce energy consumption and greenhouse gases and right-sizing the corporate fleet inventory.
- Conserving and protecting Guelph’s drinking water through investments in groundwater protection and conservation projects to meet and maintain the needs of the current community and extend City assets through education and awareness efforts.
- Investments in bus electrification reduce the City’s carbon footprint by adding zero-emission buses instead of diesel.
People and Economy:
- Investment in resourcing to achieve certain items in the Solid Waste Master Plan with goal of reducing household waste and supporting community initiatives related to waste reduction.
- Investing in resourcing and asset renewal to support downtown Guelph and efforts towards creating a vibrant downtown community.
- Investment in a new dispatch system improves emergency response by using modern and up to date technology to deliver service.
- Investments in Paramedic Services enables the City to reduce emergency response times through workforce planning to respond to emergency calls.
- Investment in Economic Development and Tourism services enables the City to support small businesses by providing more efficient and focused service.
- City-wide security infrastructure investments support community well-being through enhanced security initiatives.
- Investment into Community Benefit Agreements advances City work through partnerships with community organizations.
Operating budget investment
The budget is the tool to generate the required money (or revenue) needed to fund the cost of delivering services to the community. These revenues are generated through both property taxes and user rates.
The revenue increases for property taxes required to fund the budget over four years are included in Table 1.
| Levy type | 2024 | 2025 | 2026 | 2027 |
|---|---|---|---|---|
| Tax levy – City | 3.96% | 6.52% | 5.49% | 5.39% |
| Tax levy – Local board and shared services | 1.87% | 2.06% | 2.14% | 1.78% |
| Tax levy – Provincial housing, homelessness and hospital | 2.69% | 1.23% | 0.41% | 0.18% |
| Total tax levy increase | 8.52% | 9.80% | 8.04% | 7.35% |
The median residential property value for a single-family detached home in 2023 is $407,000. From a property tax bill perspective, the payment for property taxes over the four-year period is estimated in Table 2, below.
| Levy type | 2024 | 2025 | 2026 | 2027 |
|---|---|---|---|---|
| Annual tax | $4,752.79 | $5,218.56 | $5,638.13 | $6,052.53 |
| Increase over prior year | $373.15 | $465.77 | $419.57 | $414.40 |
| Monthly impact | $31.10 | $38.81 | $34.96 | $34.53 |
These estimates are based on 2023 assessed values and 2023 tax policy and will change annually as updated assessment values are available.
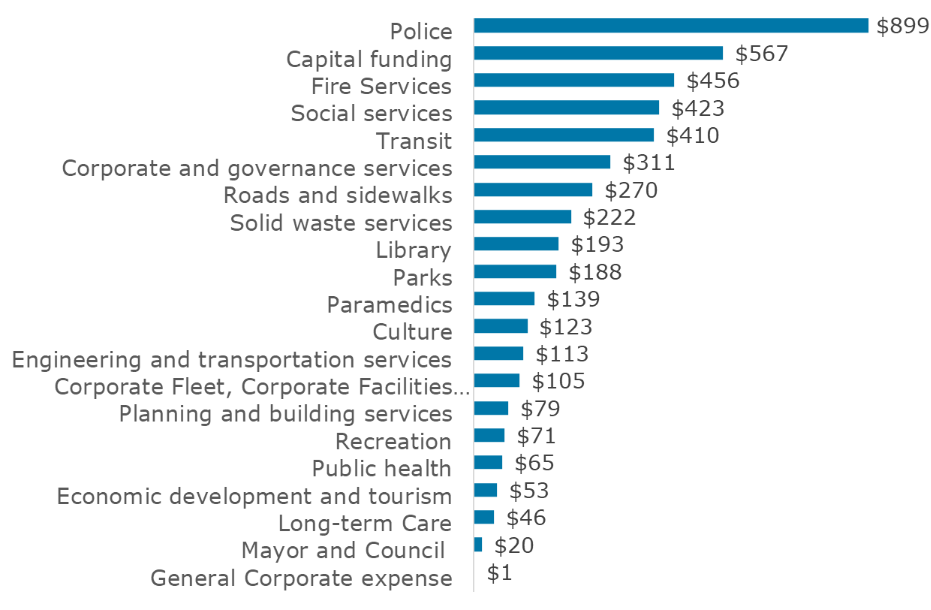
When we look at the value the budget delivers through services in our community, this is what property taxes pay for. The average homeowner payment for 2024, Figure 1, is divided as follows:
Figure 1: Average property tax cost by service for 2024
| Service | Percentage | Average cost per service |
|---|---|---|
| Police | 18.91% | $899 |
| Capital funding | 11.93% | $567 |
| Fire Services | 9.59% | $456 |
| Social services | 8.89% | $423 |
| Transit | 8.62% | $410 |
| Corporate and governance services | 6.53% | $311 |
| Roads and sidewalks | 5.68% | $270 |
| Solid waste services | 4.66% | $222 |
| Library | 4.07% | $193 |
| Parks | 3.95% | $188 |
| Paramedics | 2.92% | $139 |
| Culture | 2.58% | $123 |
| Engineering and transportation services | 2.39% | $113 |
| Corporate fleet, corporate facilities and corporate security | 2.21% | $105 |
| Planning and building services | 1.66% | $79 |
| Recreation | 1.49% | $71 |
| Public health | 1.37% | $65 |
| Economic development and tourism | 1.11% | $53 |
| Long-term care | 0.98% | $46 |
| Mayor and Council | 0.42% | $20 |
| General corporate expense | 0.03% | $1 |
The revenue increases for user rates required to fund the budget over four years are included in table 3.
| Levy type | 2024 | 2025 | 2026 | 2027 |
|---|---|---|---|---|
| Rate – City services | 4.59% | 7.49% | 8.34% | 8.20% |
| Rate – Local boards and shared services | 0.06% | 0.06% | 0.05% | 0.05% |
| Rate – Provincial housing | 3.73% | 2.14% | 1.40% | 1.02% |
| Weighted average rate increase | 8.38% | 9.69% | 9.79% | 9.27% |
The average three-person household consumes 180 cubic meters in a year and has an average impervious area of 188 square meters. The average monthly bill impact over the four-year period is outlined in Table 4.
| Rate type | 2024 | 2025 | 2026 | 2027 |
|---|---|---|---|---|
| Weighted average rate increase | 8.38% | 9.69% | 9.79% | 9.27 % |
| Increase to the average household per month | $6.94 | $9.18 | $9.93 | $8.19 |
Capital budget investment
From a capital perspective, the City is projected to spend $1.26 billion over the next four years and this work can be categorized into three drivers: infrastructure renewal, growth and service enhancement. Infrastructure Renewal remains the largest focus followed by growth-related capital investment supporting the mandated requirement for our population to grow to over 200,000 people by 2051.
Figure 2: Four-year capital budget investment by category

| Capital budget category | Total four year capital budget investment ($ millions) |
|---|---|
| Service enhancement | 293.9 |
| Infrastructure renewal | 595.9 |
| Growth | 372.0 |
From an investment by year perspective, the capital budget can be quite variable as the size and complexity of projects each year can be vastly different, demonstrated in Table 5.
| Year | Annual capital budget investment |
|---|---|
| 2024 | 208.7 |
| 2025 | 233.5 |
| 2026 | 337.8 |
| 2027 | 481.8 |
The capital budget is funded by various revenue sources, highlighted in Table 6.
| Funding source | 2024 | 2025 | 2026 | 2027 |
|---|---|---|---|---|
| Grants and subsidies | 14.6 | 23.3 | 25.6 | 43.2 |
| Development charges | 50.2 | 78.9 | 102.4 | 227.2 |
| Rate funding | 65.7 | 63.4 | 107.0 | 55.4 |
| Rate funded debt | 7.8 | 4.0 | 16.8 | 0 |
| Tax funding | 66.6 | 57.7 | 81.7 | 105.2 |
| Tax funded debt | 0 | 0 | 0 | 50.0 |
| Other | 3.8 | 6.2 | 4.3 | 0.8 |
| Total capital funding | 208.7 | 233.5 | 337.8 | 481.8 |
2024-2027 tabled budget to adopted budget
Tabled budget
| Proposed budget | 2024 net requirement $ | 2024 tax levy impact | 2025 net requirement $ | 2025 tax levy impact | 2026 net requirement $ | 2026 tax levy impact | 2027 net requirement $ | 2027 tax levy impact |
|---|---|---|---|---|---|---|---|---|
| Base budget | 295,882,530 | 0 | 329,828,159 | 0 | 364,197,218 | 0 | 399,946,643 | 0 |
| Proposed budget increase | 33,945,629 | 11.47% | 34,369,059 | 10.42% | 35,749,425 | 9.82% | 31,287,123 | 7.82% |
| Total proposed property tax levy and payment in lieu of taxes | 329,828,15 | 0 | 364,197,218 | 0 | 399,946,643 | 0 | 431,233,766 | 0 |
| Assessment Growth | (3,402,649) | (1.15%) | (3,793,024) | (1.15%) | (4,188,268) | (1.15%) | (4,599,386) | (1.15%) |
| Proposed Net tax impact | 326,425,510 | 10.32% | 360,404,194 | 9.27% | 395,758,375 | 8.67% | 426,634,380 | 6.67% |
Budget amendments
| Amendment | 2024 net requirement $ | 2024 tax levy impact | 2025 net requirement $ | 2025 tax levy impact | 2026 net requirement $ | 2026 tax levy impact | 2027 net requirement $ | 2027 tax levy impact |
|---|---|---|---|---|---|---|---|---|
| Total proposed property tax levy and payment in lieu of taxes | 329,828,159 | 0 | 364,197,218 | 0 | 399,946,643 | 0 | 431,233,766 | 0.00% |
| Reduction in County of Wellington request to support housing and homelessness | (1,005,300) | (0.34%) | 0 | 0.00% | 0 | 0.00% | 0 | 0.00% |
| Physician recruitment strategy | 43,335 | 0.01% | 0 | 0.00% | (43,335) | (0.01%) | 0 | (0.00%) |
| Physician recruitment strategy reserve funding | (43,335) | (0.01%) | 0 | 0.00% | 43,335 | 0.01% | 0 | 0.00% |
| Value for money review | 50,000 | 0.02% | 0 | 0.00% | 0 | 0.00% | 0 | 0.00% |
| Value for money reserve funding | (50,000) | (0.02%) | 0 | 0.00% | 0 | 0.00% | 0 | 0.00% |
| Downtown encampment support | 100,000 | 0.03% | (100,000) | (0.03%) | 0 | 0.00% | 0 | 0.00% |
| Downtown encampment support reserve funding | (100,000) | (0.03%) | 100,000 | 0.03% | 0 | 0.00% | 0 | 0.00% |
| Hospital levy reserve funding | (750,000) | (0.25%) | 750,000 | 0.25% | 0 | 0.00% | 0 | 0.00% |
| Phase-in library budget | (257,111) | (0.09%) | 257,111 | 0.08% | (331,200) | (0.09%) | 331,200 | 0.09% |
| Phase-in City compensation | (2,413,217) | (0.82%) | 60,493 | 0.02% | (2,083,350) | (0.58%) | 1,806,113 | 0.46% |
| Deferral of TC0072 operating impacts from 2024 to 2025 | (257,600) | (0.09%) | 257,600 | 0.08% | 0 | 0.00% | 0 | 0.00% |
| Eliminating operating impacts from TC0072 | 0 | 0 | (134,500) | (0.04%) | (234,500) | (0.07%) | 0 | 0.00% |
| Reduction to Affordable Housing Reserve | (400,000) | (0.14%) | 0 | 0.00% | 0 | 0.00% | 0 | 0.00% |
| Investigation of low income homeowner tax | 10,000 | 0.00% | (10,000) | 0.00% | 0 | 0.00% | 0 | 0.00% |
| Investigation of low income homeowner tax reserve funding | (10,000) | 0.00% | 10,000 | 0.00% | 0 | 0.00% | 0 | 0.00% |
| Reduction in Mayor and Council Training | (25,000) | 0.01% | 0 | 0.00% | 0 | 0.00% | 0 | 0.00% |
| Total adopted property tax levy and payment in lieu of taxes | 324,719,931 | 9.75% | 360,279,694 | 10.95% | 393,380,069 | 9.19% | 426,804,505 | 8.50% |
| Less: assessment growth | (3,639,355) | (1.23%) | (3,734,279) | (1.15%) | (4,143,216) | (1.15%) | (4,523,871) | (1.15%) |
| Adopted net tax impact | 321,080,576 | 8.52% | 356,545,415 | 9.80% | 389,236,853 | 8.04% | 422,280,634 | 7.35% |