Read Mayor Guthrie’s Introduction to the 2024-2027 Multi-Year Budget arrow_forward
Watch the 2024-2027 budget presentation arrow_forward
Accessibility information.
Learn about the foundations of the long-term financing tools in the budget manual.
On this page
Infrastructure Renewal Strategy
The Infrastructure Renewal Strategy funds the planned maintenance and replacement of City-owned assets. This strategy is directly linked to asset management planning—how we plan for and prioritize our infrastructure needs to achieve the greatest benefit to our community. Asset management planning is an ongoing and long-term process that deals with all decisions related to assets including building, operation and maintenance, renewal, replacement, and disposal. This strategy helps ensure that the City can continue to provide a reasonable level of service to the community.
According to the City’s most recent Asset Management Plan (AMP), the sustainable funding level for infrastructure renewal is $170 million (inflated to 2023 dollars using Non-Residential Building Construction Price Index). The AMP also identified an infrastructure backlog of $296.2 million (inflated to 2023 dollars). The City is currently in the process of updating the AMP, which will be finalized and presented to Council in mid-2024. The new AMP will provide updated estimates of the infrastructure backlog and sustainable funding target. This strategy will be reviewed to determine if changes are required after the 2024 AMP is approved by Council.
The Infrastructure Renewal Strategy is funded from multiple sources:
- property taxes;
- water, wastewater, stormwater, and parking rates;
- Canada Community-Building Fund (previously federal gas tax);
- Dedicated Gas Tax Funds for Public Transportation (provincial gas tax); and
- dividends from the City’s two wholly owned subsidiaries: Guelph Municipal Holdings Inc. (GMHI) and Guelph Junction Railway (GJR).
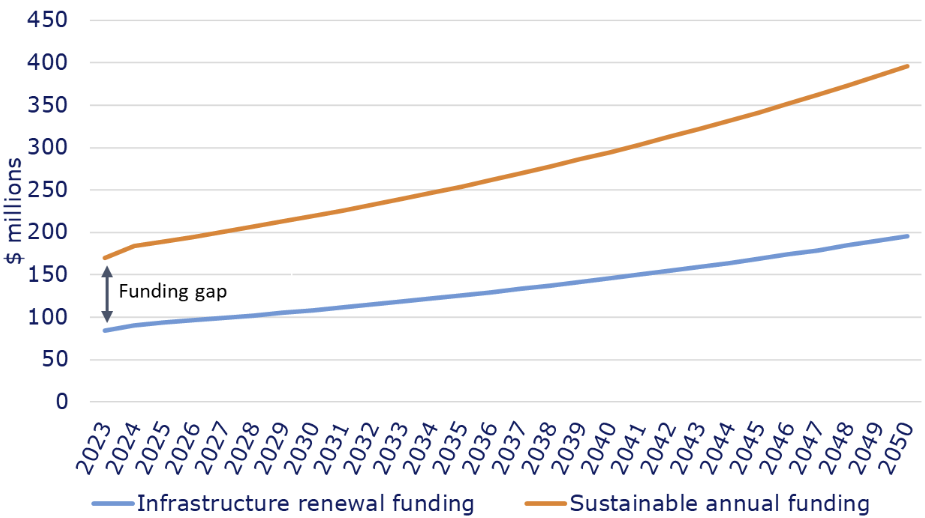
Through previous budgets, Council has built the annual funding from the City’s own-source revenues for infrastructure renewal activities to a total of $72.1 million from taxes and rates. External funding received from the Canada Community-Building Fund and Dedicated Gas Tax is also directed to infrastructure renewal activities bringing the total annual funding to $83.0 million in 2023. Maintaining this funding level with inflationary increases only would lead to an increase in the infrastructure gap as illustrated in Figure 6 below.
Figure 6: Infrastructure renewal funding compared to sustainable annual funding target—status quo
| Year | Infrastructure renewal funding ($ millions) | Sustainable annual funding ($ millions) |
|---|---|---|
| 2023 | $84 | $170 |
| 2024 | $91 | $184 |
| 2025 | $93 | $189 |
| 2026 | $96 | $195 |
| 2027 | $99 | $201 |
| 2028 | $102 | $207 |
| 2029 | $105 | $213 |
| 2030 | $108 | $219 |
| 2031 | $112 | $226 |
| 2032 | $115 | $233 |
| 2033 | $118 | $240 |
| 2034 | $122 | $247 |
| 2035 | $126 | $254 |
| 2036 | $129 | $262 |
| 2037 | $133 | $270 |
| 2038 | $137 | $278 |
| 2039 | $141 | $286 |
| 2040 | $146 | $295 |
| 2041 | $150 | $303 |
| 2042 | $154 | $313 |
| 2043 | $159 | $322 |
| 2044 | $164 | $332 |
| 2045 | $169 | $342 |
| 2046 | $174 | $352 |
| 2047 | $179 | $362 |
| 2048 | $184 | $373 |
| 2049 | $190 | $384 |
| 2050 | $196 | $396 |
Updates to the Infrastructure Renewal Strategy through the 2024-2027 Multi-Year Budget have been developed to balance affordability impacts from rate and property tax increases along with the increased risks and operating costs that will result from allowing more assets to deteriorate into poorer conditions. The updates build on the accomplishments of previous budgets and aim to continue the progression towards a sustainable funding level. Changes to the strategy will be discussed separately for tax and rate-supported services.
Infrastructure Renewal Strategy funding for tax-supported services
For tax-supported services, infrastructure renewal activities are funded from property taxes—Infrastructure Renewal (150), Library Capital (157), and Police Capital (158) reserve funds, and external funding from upper levels of government—Canada Community-Building Fund (CCBF) and Dedicated Gas Tax (DGT). CCBF funding can be applied to a variety of project types and services in accordance with the funding agreement. On the other hand, DGT funding can only be used to fund transit projects per the funding agreement. These two external funding programs are relatively stable and the City anticipates it will continue to receive funding through these programs.
Table 26 summarizes the annual infrastructure renewal funding for tax-supported services. The forecast assumes no major changes to the external funding received. From 2024 to 2027. A new funding agreement for the CCBF is expected in 2024 and staff will update the forecasts to reflect any changes that are announced as part of future budget confirmation processes. Table 27 presents the projected year-end uncommitted reserve fund balances for the property tax funded, DGT, and CCBF reserve funds.
| Funding source | 2023 | 2024 | 2025 | 2026 | 2027 |
|---|---|---|---|---|---|
| Property tax | 28.4 | 34.6 | 40.5 | 47.7 | 55.1 |
| Dedicated Gas Tax | 3.2 | 3.2 | 3.2 | 3.2 | 3.2 |
| Canada Community-Building Fund | 8.7 | 8.7 | 8.9 | 8.9 | 9.0 |
| Total | 40.3 | 46.5 | 52.5 | 59.8 | 67.3 |
| Funding source | 2023 | 2024 | 2025 | 2026 | 2027 | 2028 | 2029 | 2030 | 2031 | 2032 | 2033 |
|---|---|---|---|---|---|---|---|---|---|---|---|
| Infrastructure Renewal (150) | 5.2 | (10.6) | (20.6) | (35.9) | (75.1) | (118.6) | (131.3) | (143.8) | (154.2) | (131.0) | (128.0) |
| Library Capital (157) | 2.7 | 4.5 | 6.6 | 8.2 | 10.4 | 12.4 | 14.7 | 16.8 | 19.3 | 22.0 | 24.8 |
| Police Capital (158) | 3.0 | 2.5 | 2.9 | 2.7 | 0.9 | 0.6 | 1.3 | 0.8 | 2.1 | 2.8 | 1.1 |
| Dedicated Gas Tax (342) | 2.2 | 2.2 | 2.2 | 2.1 | 1.9 | 2.0 | 2.0 | 2.0 | 1.9 | 1.7 | 1.5 |
| Canada Community Building Fund (343) | 13.6 | 17.5 | 14.3 | 13.3 | 15.3 | 2.8 | 3.3 | (1.9) | (1.0) | (2.2) | 6.8 |
| Total | 26.7 | 16.1 | 5.3 | (9.5) | (46.6) | (100.7) | (110.0) | (126.0) | (131.9) | (106.6) | (93.8) |
A fulsome discussion on tax-supported funding for the Infrastructure Renewal Strategy and resulting impacts on the tax funded reserve funds is provided below.
Tax support for the Infrastructure Renewal Strategy
Tax support for the Infrastructure Renewal Strategy is provided through annual transfers to the Infrastructure Renewal (150), Library Capital (157), and Police Capital (158) reserve funds. Council has built the total annual transfers to these reserve funds to $28.4 million in 2023. The breakdown of funding between these reserve funds is presented in Table 28.
| Description | 2023 | 2024 | 2025 | 2026 | 2027 |
|---|---|---|---|---|---|
| Infrastructure Renewal (150) | 22.4 | 28.2 | 33.9 | 40.3 | 47.5 |
| Library Capital (157) | 1.9 | 2.1 | 2.2 | 2.2 | 2.3 |
| Police Capital (158) | 4.1 | 4.2 | 4.4 | 5.2 | 5.4 |
| Total | 28.4 | 34.6 | 40.5 | 47.7 | 55.1 |
Since the Infrastructure Renewal reserve fund (150) covers most of the City’s services, including roads and facilities, it faces the most pressures. As in prior budgets, dividend income and 0.9 per cent of the net tax levy will continue to be directed primarily to this reserve fund. The transfer will also be increased by the estimated annual lifecycle contribution for growth and service enhancement funded infrastructure. An initial allocation for the lifecycle contribution for large facility projects coming online in the next four years (Baker and South End Community Centre) has also been included.
An adjustment to reflect higher than forecast inflation from 2021 to 2023 was also considered in addition to the traditional annual inflationary adjustments. This inflationary adjustment, along with adding back the $1.4 million reduction to the transfer made as part of the 2023 budget confirmation process, would result in a total calculated transfer of $43.1 million for 2024. While that level of funding would get the City to its sustainable funding target faster, it would require large increases to the tax levy. In consideration of the affordability concerns, the strategy proposes a more gradual approach to increasing this annual transfer instead with $34.6 million in 2024 (versus $43.1 million).
As shown in Table 29, even with his proposed increase over 2023 tax supported funding, the Infrastructure Renewal reserve fund will be in a deficit position for 2024 to 2033. A summary of the 10-year reserve fund forecast is provided in Table 29.
| Description | 2023 | 2024 | 2025 | 2026 | 2027 | 2028 | 2029 | 2030 | 2031 | 2032 | 2033 |
|---|---|---|---|---|---|---|---|---|---|---|---|
| Opening balance | 49.1 | 5.2 | (10.6) | (20.6) | (35.9) | (75.1) | (118.6) | (131.3) | (143.8) | (154.2) | (131.0) |
| Transfers from operating | 22.6 | 29.7 | 35.0 | 41.4 | 48.6 | 54.3 | 60.4 | 66.9 | 73.9 | 81.3 | 89.2 |
| Interest earned | 0.4 | 0.0 | (0.2) | (0.4) | (0.8) | (1.4) | (1.9) | (2.0) | (2.2) | (2.1) | (1.9) |
| Capital expenditures | (66.9) | (45.5) | (44.8) | (56.3) | (87.0) | (96.3) | (71.3) | (77.3) | (82.1) | (55.9) | (84.3) |
| Closing balance | 5.2 | (10.6) | (20.6) | (35.9) | (75.1) | (118.6) | (131.3) | (143.8) | (154.2) | (131.0) | (128.0) |
As mentioned earlier, DGT funding can only be used to fund transit projects while CCBF funding is less restrictive. Surplus available funds in CCBF reserve fund will help manage the cash flow challenges resulting from the deficits in the Infrastructure Renewal reserve fund before 2029 as shown in Table 27. Staff will continue to work on revising the capital forecast to reprioritize the projects to balance the Infrastructure Renewal reserve fund in 2025 through 2033 and beyond. Changes resulting from this work will be presented to Council through future budget confirmation processes.
The annual transfers to the Library Capital and Police Capital reserve funds will be increased annually based on inflation. The transfer to the Library Capital reserve fund (157) includes debt repayment costs for the Baker District Library (LB0028) which is expected to be issued from 2026 to 2027. These costs are currently scheduled to be funded from the Infrastructure Renewal reserve fund while the funding is going into the Library Capital reserve fund. The funds will be transferred to the Infrastructure Renewal reserve fund (150) as part of future budget confirmation processes. An updated forecast for the Library Capital reserve fund reflecting the reduced transfer and balance will be provided to Council as part future budget confirmation processes. This will be an administrative, net zero tax levy impact adjustment.
For the Police Capital reserve fund (158), there will be a transfer from the City’s Infrastructure Renewal reserve fund (150) beginning in 2026 of $376 thousand to cover the anticipated cost of refinancing debt for a completed project. This transfer from the Infrastructure Renewal reserve fund will be for the duration of the debt term. Table 30 and Table 31 provide the reserve fund forecasts for the Library Capital and Police Capital reserve funds.
| Description | 2023 | 2024 | 2025 | 2026 | 2027 | 2028 | 2029 | 2030 | 2031 | 2032 | 2033 |
|---|---|---|---|---|---|---|---|---|---|---|---|
| Opening balance | 1.7 | 2.7 | 4.5 | 6.6 | 8.2 | 10.4 | 12.4 | 14.7 | 16.8 | 19.3 | 22.0 |
| Transfers from operating | 1.9 | 2.1 | 2.2 | 2.2 | 2.3 | 2.4 | 2.4 | 2.5 | 2.6 | 2.6 | 2.7 |
| Interest earned | 0.0 | 0.1 | 0.1 | 0.1 | 0.1 | 0.2 | 0.2 | 0.2 | 0.3 | 0.3 | 0.3 |
| Capital expenditures | (0.9) | (0.4) | (0.2) | (0.7) | (0.3) | (0.5) | (0.3) | (0.6) | (0.4) | (0.2) | (0.3) |
| Closing balance | 2.7 | 4.5 | 6.6 | 8.2 | 10.4 | 12.4 | 14.7 | 16.8 | 19.3 | 22.0 | 24.8 |
| Description | 2023 | 2024 | 2025 | 2026 | 2027 | 2028 | 2029 | 2030 | 2031 | 2032 | 2033 |
|---|---|---|---|---|---|---|---|---|---|---|---|
| Opening balance | 4.6 | 3.0 | 2.5 | 2.9 | 2.7 | 0.9 | 0.6 | 1.3 | 0.8 | 2.1 | 2.8 |
| Transfers from operating | 4.1 | 4.2 | 4.4 | 5.2 | 5.4 | 5.5 | 5.7 | 5.8 | 6.0 | 6.2 | 6.3 |
| Interest earned | 0.1 | 0.0 | 0.0 | 0.0 | 0.0 | 0.0 | 0.0 | 0.0 | 0.0 | 0.0 | 0.0 |
| Capital expenditures | (5.8) | (4.7) | (4.1) | (5.4) | (7.2) | (5.8) | (5.0) | (6.3) | (4.7) | (5.5) | (8.0) |
| Closing balance | 3.0 | 2.5 | 2.9 | 2.7 | 0.9 | 0.6 | 1.3 | 0.8 | 2.1 | 2.8 | 1.1 |
Rate-supported Infrastructure Renewal Strategy funding
The Infrastructure Renewal Strategy provides rate-supported funding through annual transfers to the respective reserve funds for the following services:
- parking;
- water;
- wastewater; and
- stormwater.
Parking
The Infrastructure Renewal Strategy for parking is through an annual transfer from parking revenues to the Parking Capital reserve fund (151). Through previous budget, Council built the transfer to $3.5 million in 2023 as shown in Table 32. Based on the status of the reserve over the 10-year period to 2033, the transfer will be initially reduced to $2.4 million in 2024. Gradual increases and inflation will see this transfer increase over the 10-year period to $3.8 million in 2033. A summary of the reserve fund forecast is provided in Table 33 below. These funds are required for major replacement/renewal work on the City’s parkades planned beyond the 10-year forecast.
| Description | 2023 | 2024 | 2025 | 2026 | 2027 |
|---|---|---|---|---|---|
| Total transfer to reserve fund | 3.5 | 2.4 | 3.0 | 2.9 | 3.0 |
| Description | 2023 | 2024 | 2025 | 2026 | 2027 | 2028 | 2029 | 2030 | 2031 | 2032 | 2033 |
|---|---|---|---|---|---|---|---|---|---|---|---|
| Opening balance | 6.3 | 6.6 | 7.4 | 8.8 | 9.8 | 10.8 | 9.6 | 11.0 | 11.9 | 13.6 | 15.2 |
| Transfers from operating | 3.5 | 2.4 | 3.0 | 2.9 | 3.0 | 3.1 | 3.3 | 3.4 | 3.5 | 3.7 | 3.8 |
| Interest earned | 0.1 | 0.1 | 0.1 | 0.1 | 0.2 | 0.2 | 0.2 | 0.2 | 0.2 | 0.2 | 0.2 |
| Capital Expenditures | (3.3) | (1.7) | (1.7) | (2.0) | (2.2) | (4.5) | (2.0) | (2.6) | (2.0) | (2.2) | (1.9) |
| Closing balance | 6.6 | 7.4 | 8.8 | 9.8 | 10.8 | 9.6 | 11.0 | 11.9 | 13.6 | 15.2 | 17.4 |
Water, wastewater, and stormwater
Through previous budgets, Council built annual transfers to the respective reserve funds for this strategy to $38.6 million from rates:
- $14.8 million from water rates to the Water Capital reserve fund (152);
- $15.7 million from wastewater rates to the Wastewater Capital reserve fund (153); and
- $8.2 million from stormwater rates to the Stormwater Capital reserve fund (165).
This funding level is less than the sustainable funding target and would not be sufficient to fund the needs identified in the capital budget and forecast. As part of the 2024 to 2027 Multi-Year Budget process, funding will be increased to be able to support the capital projects that are required.
| Reserve fund | 2023 | 2024 | 2025 | 2026 | 2027 |
|---|---|---|---|---|---|
| Water Capital (152) | 14.8 | 17.7 | 19.7 | 22.3 | 25.5 |
| Wastewater Capital (153) | 15.7 | 16.5 | 18.6 | 21.4 | 24.9 |
| Stormwater Capital (165) | 8.2 | 10.0 | 11.7 | 13.2 | 15.0 |
| Total | 38.6 | 44.2 | 50.0 | 56.9 | 65.4 |
In addition to annual inflationary increases each year, the annual transfer will also increase by one per cent of the previous year’s transfer and an estimate of the annual lifecycle contribution for new Development Charge funded infrastructure. Adjustments to reflect higher than forecast inflation from 2020 to 2023 were also considered in addition to the traditional annual inflationary adjustments and would have required significant rate increases for all three services. To help manage affordability concerns, the strategy proposes the annual transfers will be gradually increased as presented in Table 34 above.
Annual funding for the Growth Strategy for water, wastewater, and stormwater services is through the same reserve funds—Water Capital, Wastewater Capital, and Stormwater Capital. As a result, the reserve fund forecasts are provided in the Growth Strategy section.
Sustainable funding outcome
Figure 7 compares the annual funding level through the Infrastructure Renewal Strategy as outlined in this document to the sustainable funding level target. This gradual approach would allow the City to reach the sustainable funding target in 2035.
Figure 7: Infrastructure renewal funding compared to sustainable annual funding target—2024 to 2027 multi-year budget

| Year | Infrastructure renewal funding ($ millions) | Sustainable annual funding ($ millions) |
|---|---|---|
| 2023 | 83 | 170 |
| 2024 | 92 | 184 |
| 2025 | 104 | 189 |
| 2026 | 117 | 195 |
| 2027 | 133 | 201 |
| 2028 | 144 | 207 |
| 2029 | 157 | 213 |
| 2030 | 171 | 219 |
| 2031 | 186 | 226 |
| 2032 | 203 | 233 |
| 2033 | 222 | 240 |
| 2034 | 238 | 247 |
| 2035 | 255 | 254 |
Growth Strategy
The purpose of the Growth Strategy is to fund growth-related costs. The City uses growth-related revenues to pay for the costs of growth to the extent allowed by legislation. The growth revenues used to pay for growth-related capital expenses are collected from:
- Cash-in-lieu of parkland dedication;
- Community benefit charges;
- Development charges;
- Property tax assessment growth; and
- Utility rate revenue growth.
Cash-in-lieu of parkland dedication
The City aims to maximize the funding from all growth revenue streams and will be reviewing its policies regarding parkland dedication and cash-in-lieu of parkland. The City’s Parkland Dedication By-law (2022)-20717 was passed in 2022, however, a review and update will need to be undertaken to ensure that the City maximizes revenues through that bylaw in light of Bill 23 changes. Table 35 presents consolidated year-end balances for the City’s parkland reserve funds.
Community benefits charges
The City currently collects the maximum community benefit charge (CBC) amount allowed under the Planning Act—four per cent of land value. The Community Benefits Charge Strategy which identifies the facilities, services, and matters that will be funded from CBCs, will be updated in 2027. Although the rate will not increase from four per cent of land value, this update will allow the City to incorporate the costs of services previously recovered from DCs, which are now ineligible for DCs, and prioritize the use of CBC funds to support the City’s objectives. Since CBCs are fairly new to the City, the revenue forecast is based on the City’s collection since 2022. Forecast year-end balances for the CBC reserve fund are also presented in Table 35.
Development charges
DCs are the largest funding source for growth-related capital. The City’s current DC bylaw, By-law (2019)-20372, as amended, will be expiring on March 2, 2024. To ensure the City can continue collecting DCs, the City is currently undertaking a DC background study process and a new bylaw is expected to be passed in January 2024. As part of that process, new DC rates were calculated and proposed in the 2023 Development Charges Background Study dated September 27, 2023.
The analysis for the 2024 to 2027 multi-year budget process is based on the proposed DC rates and growth forecast from the 2023 Development Charges Background Study. Some of the growth capital will need to be in place in advance of the growth occurring resulting in a mismatch in timing between the costs and revenue. As a result, some of the DC reserve funds will not have enough funds to pay for the costs. Debt capacity has been reserved for DC funded infrastructure which will assist in addressing the negative fund balances currently presented.
As mentioned in the Capital Summary, some of the DC-funded projects have been deferred and deemed as “contingent on funding”. The City is investigating the use of front-ending agreements to finance these projects before the DC revenue collections. Front-ending agreements will help the City address the cash flow challenges and reduce the reliance on external borrowing. A summary and description of these projects is provided as an attachment to the Council budget memo: Guelph’s 2024-2027 Multi-Year Budget.
Table 35 also presents a forecast of the consolidated DC year-end reserve fund balances. These balances reflect any project-specific debt but do not reflect the debt capacity earmarked for DC projects as outlined in the Debt Strategy.
| Reserve fund grouping | 2023 | 2024 | 2025 | 2026 | 2027 | 2028 | 2029 | 2030 | 2031 | 2032 | 2033 |
|---|---|---|---|---|---|---|---|---|---|---|---|
| Parkland dedication | 15.7 | 16.7 | 16.2 | 17.3 | (7.6) | (6.9) | (6.5) | (5.8) | (5.4) | (5.0) | (4.6) |
| Community benefits charges | 0.9 | 1.4 | 1.7 | 2.1 | 0.6 | 1.0 | 1.5 | 1.9 | 2.2 | 2.6 | 3.1 |
| Development charges | 21.5 | 37.1 | 61.2 | 31.8 | (93.1) | (118.2) | (110.8) | (76.9) | (109.2) | (82.8) | (48.4) |
The Growth Strategy also funds the growth-related costs that are not funded from another growth-specific revenue stream such as DCs. This includes costs for services not eligible to be recovered from DCs such as growth studies and lost DC revenue from exemptions, discounts, and phase-in of new DC rates. Growth-related costs for utility rate supported services are funded from rates through an annual transfer to the capital reserve fund for each respective service.
Growth related costs that are not eligible for funding through one of the specific growth revenue funding streams (PD, CBCs, DCs) are funded from property tax revenue through an annual transfer to the Growth Reserve Fund (156). Capital costs are then funded from Reserve Fund 156 directly. The cost of DC exemptions, discounts, and the DC rate phase-in will be funded based on actual exemptions provided or revenue lost through transfers from these reserve funds to the service-specific DC reserve fund.
Tax-supported services
Through previous budgets, Council has built the annual funding transfer to the Growth Reserve Fund (156) to $3.6 million to fund the growth-related costs for tax-supported services. This level of annual funding transfer is not sufficient to fund the needs anticipated for the 10-year period to 2033. These needs are higher than the historical amounts due to changes arising from Bill 23. Specifically, more exemptions, new discounts, removal of some capital costs from DC funding eligibility (e.g., studies and parking), and the phase-in of the new DC bylaw rates, will result in lost DC revenue that will also need to be funded from property taxes. These costs are in addition to the costs of historically non-DC eligible costs (e.g., solid waste costs – non-diversion related). It is important to note that the strategy has been developed based on an estimate of the forecasted exemptions, discounts, and phase-in costs prepared as part of the ongoing Development Charges Background Study update.
| Description | 2023 | 2024 | 2025 | 2026 | 2027 |
|---|---|---|---|---|---|
| Total transfer to reserve fund | 3.6 | 5.8 | 7.5 | 9.0 | 10.5 |
The City is currently undertaking the process of passing a new DC bylaw to continue collecting DCs. The new rates will be phased in over a five-year period in accordance with the Bill 23. As a result of the phase in, we anticipate the demands on this reserve fund to be higher in the first five years of the bylaw than in the final five years of the bylaw. Increasing the annual transfer through this strategy to fully fund these anticipated costs in the five-year period would require large property tax increases upfront and potential decreases for the later five-year period. To smooth out the operating impact, the strategy considered a 10-year period and phased in the increase to the annual transfer gradually to allow the full costs to be recovered over a 12-year period.
Due to the pressures on the reserve fund, the annual funding transfer will be increased from 2024 to 2027 as shown in Table 36. The strategy will increase the total annual funding from $3.6 million in 2023 to $10.5 million in 2027. Inflationary increases will continue to be applied annually until 2033. A summary of the reserve fund forecast is provided in Table 37.
| Description | 2023 | 2024 | 2025 | 2026 | 2027 | 2028 | 2029 | 2030 | 2031 | 2032 | 2033 |
|---|---|---|---|---|---|---|---|---|---|---|---|
| Opening balance | 4.0 | (1.2) | (12.6) | (20.9) | (26.5) | (27.1) | (26.5) | (26.8) | (23.9) | (18.3) | (15.0) |
| Transfers from operating | 3.6 | 5.8 | 7.5 | 9.0 | 10.5 | 10.8 | 11.2 | 11.5 | 11.8 | 12.2 | 12.6 |
| Interest earned | 0.0 | (0.1) | (0.2) | (0.4) | (0.4) | (0.4) | (0.4) | (0.4) | (0.3) | (0.2) | (0.2) |
| Capital expenditures | (1.3) | (0.6) | (1.0) | (1.1) | (0.5) | (2.2) | (3.4) | (0.6) | (0.6) | (2.4) | (2.0) |
| Transfer to other reserve funds | (7.5) | (16.5) | (14.7) | (13.1) | (10.2) | (7.7) | (7.7) | (7.7) | (5.3) | (6.3) | (6.3) |
| Closing balance | (1.2) | (12.6) | (20.9) | (26.5) | (27.1) | (26.5) | (26.8) | (23.9) | (18.3) | (15.0) | (10.9) |
As shown in Table 37, the Growth Reserve Fund is expected to be in a deficit position for the 10-year period to 2033. With new DC bylaw rates and associated phase in costs starting in 2024, the reserve position will deteriorate initially to a low of negative $27.1 million in 2027 before improving over the final years of the bylaw. The pace of development in the City will inform the actual amount to be transferred to the DC reserve funds annually. DC collections and exemptions, discounts, and phase-in costs will be monitored closely by staff and reported on quarterly through the Budget Monitoring Reports throughout the year.
The Province has committed to making municipalities whole for these lost DC revenues, and recently announced a new funding stream called the Building Faster Fund. If received, this funding will be used to supplement tax funding for lost DC revenue from Bill 23 and help reduce the deficits in the Growth Reserve Fund. At present, it is unclear how much the City could receive because the details of the fund have not been announced, and the funding is partially based on the City’s performance relative to the Housing Pledge. This is especially noteworthy because the City does not directly control development. Staff will continue to follow provincial announcements closely and will notify Council of any funding announcements that can be applied to fund the incremental costs arising from legislative changes. This strategy will be revisited in future budget confirmation processes as actual collections, DC exemptions, discounts, phase-in costs, assessment growth related to the Housing Pledge, and provincial funding to make Guelph whole become known. If assessment growth resulting from increased housing to meet the Housing Pledge is realized, it would also help fund the deficit within this reserve as well as shortfalls in the City’s contingency reserves relative to target balances.
Utility (water, wastewater and storm water) rate supported services
Historically, utility rate-supported funding for the Growth Strategy was provided through a transfer from the Water Contingency (181) and Wastewater Contingency (182) reserves. This approach is no longer appropriate given the level of the funding required because of changes in legislation. As a result, utility rate support for the Growth Strategy, by service, will now be provided through an annual transfer from rate revenue to the respective capital reserves for water, wastewater, and stormwater. In addition, increases to the funding through this strategy are required to cover the incremental costs associated with the legislative changes as discussed above.
The transfers will be increased annually to adjust for inflation. In addition to inflationary adjustments, increases to the transfer are proposed for the period 2024 to 2027 as presented in Table 38. For 2028 through 2033, only inflationary increases have been included in the analysis.
| Description | 2023 | 2024 | 2025 | 2026 | 2027 |
|---|---|---|---|---|---|
| Water Capital (152) | 0.3 | 1.0 | 2.0 | 0.8 | 3.4 |
| Wastewater Capital (153) | 0.3 | 1.0 | 1.8 | 2.3 | 2.9 |
| Stormwater Capital (165) | 0.0 | 0.1 | 0.2 | 0.2 | 0.3 |
| Total | 0.6 | 2.1 | 4.0 | 5.4 | 6.7 |
As mentioned earlier, funding for both the Infrastructure Renewal Strategy and Growth Strategy is transferred to the respective capital reserve funds. The following tables show the transfers to Water Capital, Wastewater Capital, and Stormwater Capital reserve funds for the Infrastructure Renewal Strategy and the Growth Strategy. The corresponding reserve fund forecast is also provided for each service. It is important to note that the additional funding for each service under the Growth Strategy to respond to Bill 23 is insufficient to cover the projected costs in the short-term. This impacts the rate supported capital funding available for non-growth-related capital as noted in the non-tax supported budget section of the operating budget summary document.
Table 39 presents the annual transfers to the Water Capital reserve fund (152). A summary of the 10-year reserve fund forecast is provided in Table 40. As shown in Table 40 below, the reserve fund will be in a deficit position over the forecast period. Some of the water capital needs will be financed by external debt as well as internal borrowing from other City reserves, and this is reflected in the balances below. Staff are reviewing the capital program to identify further opportunities for deferring projects to work within available funding. The City is currently preparing a long-range financial plan, which may result in changes to the water rates to ensure the service is sustainably funded. Council will receive a report on this work in early 2024.
| Description | 2023 | 2024 | 2025 | 2026 | 2027 |
|---|---|---|---|---|---|
| Growth strategy | 0.3 | 1.0 | 2.0 | 2.8 | 3.4 |
| Infrastructure renewal | 14.8 | 17.7 | 19.7 | 22.3 | 25.5 |
| Total transfer to reserve fund | 15.1 | 18.7 | 21.7 | 25.1 | 28.9 |
| Description | 2023 | 2024 | 2025 | 2026 | 2027 | 2028 | 2029 | 2030 | 2031 | 2032 | 2033 |
|---|---|---|---|---|---|---|---|---|---|---|---|
| Opening balance | 45.9 | 7.3 | (6.3) | (15.7) | (15.2) | (19.6) | (50.0) | (76.1) | (111.4) | (181.9) | (187.0) |
| Transfers from operating | 15.1 | 18.7 | 21.7 | 25.1 | 28.9 | 31.5 | 34.3 | 37.4 | 40.8 | 44.4 | 48.4 |
| Interest earned | 0.4 | 0.0 | (0.2) | (0.2) | (0.3) | (0.5) | (0.9) | (1.4) | (2.2) | (2.7) | (2.8) |
| Capital expenditures | (51.2) | (27.0) | (26.2) | (20.2) | (29.8) | (58.8) | (57.0) | (68.9) | (107.3) | (44.7) | (44.8) |
| Transfer to other reserve funds | (2.9) | (5.3) | (4.7) | (4.2) | (3.3) | (2.4) | (2.4) | (2.4) | (1.8) | (2.1) | (2.1) |
| Closing balance | 7.3 | (6.3) | (15.7) | (15.2) | (19.6) | (50.0) | (76.1) | (111.4) | (181.9) | (187.0) | (188.2) |
Table 41 presents the annual transfers to the Wastewater Capital reserve fund (153). A summary of the 10-year reserve fund forecast is provided in Table 42. The Wastewater Capital reserve is adequately funded over the 10-year forecast period.
| Description | 2023 | 2024 | 2025 | 2026 | 2027 |
|---|---|---|---|---|---|
| Growth strategy | 0.3 | 1.0 | 1.8 | 2.3 | 2.9 |
| Infrastructure renewal | 15.7 | 16.5 | 18.6 | 21.4 | 24.9 |
| Total transfer to reserve fund | 16.0 | 17.5 | 20.4 | 23.7 | 27.8 |
| Description | 2023 | 2024 | 2025 | 2026 | 2027 | 2028 | 2029 | 2030 | 2031 | 2032 | 2033 |
|---|---|---|---|---|---|---|---|---|---|---|---|
| Opening balance | 103.6 | 66.9 | 56.4 | 52.8 | 3.4 | 15.5 | 9.7 | 20.6 | 21.3 | 28.3 | 14.6 |
| Transfers from operating | 16.0 | 17.5 | 20.4 | 23.7 | 27.8 | 30.0 | 32.7 | 35.5 | 37.6 | 41.0 | 44.7 |
| Interest earned | 1.3 | 0.9 | 0.8 | 0.4 | 0.1 | 0.2 | 0.2 | 0.3 | 0.4 | 0.3 | 0.3 |
| Capital expenditures | (5.1) | (24.9) | (21.3) | (70.3) | (13.4) | (34.2) | (20.2) | (33.3) | (29.6) | (53.4) | (30.6) |
| Transfer to other reserve funds | (2.7) | (4.0) | (3.5) | (3.2) | (2.4) | (1.8) | (1.8) | (1.8) | (1.3) | (1.6) | (1.6) |
| Closing balance | 66.9 | 56.4 | 52.8 | 3.4 | 15.5 | 9.7 | 20.6 | 21.3 | 28.3 | 14.6 | 27.5 |
Table 43 presents the annual transfers to the Stormwater Capital reserve fund (165). A summary of the 10-year reserve fund forecast is provided in Table 44. The Stormwater Capital reserve fund will be in a deficit position from 2028 to 2033 based on the current capital program. Staff are reviewing the capital program to reprioritize and defer projects and ensure the capital plan can be fully funded from the reserve fund. The updated capital plan and reserve fund impacts will be presented to Council during future budget confirmation processes.
| Description | 2023 | 2024 | 2025 | 2026 | 2027 |
|---|---|---|---|---|---|
| Growth strategy | 0.0 | 0.1 | 0.2 | 0.2 | 0.3 |
| Infrastructure renewal | 8.2 | 10.0 | 11.7 | 13.2 | 15.0 |
| Total transfer to reserve fund | 8.2 | 10.1 | 11.8 | 13.5 | 15.4 |
| Description | 2023 | 2024 | 2025 | 2026 | 2027 | 2028 | 2029 | 2030 | 2031 | 2032 | 2033 |
|---|---|---|---|---|---|---|---|---|---|---|---|
| Opening balance | 16.3 | 6.5 | 4.7 | 2.4 | 1.6 | 6.7 | (45.7) | (58.5) | (85.9) | (95.2) | (124.7) |
| Transfers from operating | 8.2 | 10.1 | 11.8 | 13.5 | 15.4 | 16.6 | 17.9 | 19.3 | 20.9 | 23.6 | 26.6 |
| Interest earned | 0.2 | 0.1 | 0.1 | 0.0 | 0.1 | (0.3) | (0.8) | (1.1) | (1.3) | (1.6) | (1.9) |
| Capital expenditures | (18.0) | (11.7) | (13.8) | (14.1) | (10.2) | (68.5) | (29.7) | (45.5) | (28.7) | (51.3) | (27.3) |
| Transfer to other reserve funds | (0.1) | (0.3) | (0.3) | (0.2) | (0.2) | (0.1) | (0.1) | (0.1) | (0.1) | (0.1) | (0.1) |
| Closing balance | 6.5 | 4.7 | 2.4 | 1.6 | 6.7 | (45.7) | (58.5) | (85.9) | (95.2) | (124.7) | (127.4) |
Service Enhancement Strategy
The Service Enhancement Strategy (formerly City Building Strategy) supports investments to advance Council’s strategic plan and approved service delivery master plans to increase service levels for the community. This strategy is funded from property taxes through an annual transfer from the operating budget to the Service Enhancement reserve fund (159). The funding transfer consists of a recurring portion as well as time-limited transfers earmarked for specific purposes. For example, a time-limited transfer was used to gradually phase in the operating impacts for the new library over a few years to avoid large increases in the tax rate when the library opens. In the years before the library opens, those funds are directed towards the Service Enhancement reserve fund (159) and the Efficiency, Innovation, and Opportunity reserve fund (351). These temporary increases to the transfer will end when the library operating costs for the new main branch are added to the operating budget.
Through previous budgets, Council built transfers to the reserve fund for this strategy to $7.3 million in 2023. Of that 2023 transfer, $2.2 million can be classified as an occasional transfer, as part of the phase in of the operating costs for the Baker District and South End Community Centre (SECC) in advance of those projects being completed. The remaining $5.1 million forms the base (or recurring) annual transfer to the Service Enhancement reserve fund.
The strategy currently funds projects in the following categories:
- Baker District
- Active transportation network including Cycling Master Plan
- City facilities and other corporate plans and initiatives
- Guelph Trail Master Plan, Urban Forest Management Plan, and open spaces
- Investment in digital services and customer service
- Transit Route Review and other service enhancements
The completion and approval of various master plans resulted in an increase in the number and value of service enhancement projects being added to the 10-year capital budget and forecast. These projects generally fall into the categories identified above.
The reserve fund will have a negative (uncommitted) balance at the end of 2023. Maintaining the existing annual funding level would result in further deterioration of the reserve fund compared with the proposed capital plan. To maintain affordability for the Guelph community, staff deferred some of the projects beyond the 10-year forecast period. Other projects will only continue if the City is able to find alternative funding or identify a sustainable funding source. A summary and description of these projects is provided as an attachment to the Council budget memo: Guelph’s 2024-2027 Multi-Year Budget. Despite these actions, the annual transfer still needs to be increased to fund the projects in the capital budget and forecast.
Details underlying the annual transfers for 2023 and the four-year period to 2027 are presented in Table 45 below. The time-limited transfers for the Baker District Central Library and SECC that were approved as part of previous budgets will be maintained for 2024 and 2025, with reductions for the Baker District transfer as outlined in Information Report 2023-425 – Baker District Operating Budget Update, and reflected in the table below. Increases to the recurring portion of the transfer are based on inflation, prior Council approvals, as well as the amount required to ensure a sustainable reserve fund over the forecast period. In previous budgets, Council approved increasing the transfer by $500 thousand in 2024. This increase would be maintained along with an annual increase of 0.1 per cent of the net tax levy (part of the Dedicated Infrastructure Levy for which the other 0.9 per cent goes to the Infrastructure Renewal reserve fund 150). Further increases to the transfer of $500 thousand annually from 2026 to 2030 are required to provide sufficient funding for the projects in the 10-year capital budget and forecast. This will raise the total (recurring) annual funding to this reserve fund from $5.1 million to $8.2 million in 2027.
| Description | 2023 | 2024 | 2025 | 2026 | 2027 |
|---|---|---|---|---|---|
| Time-limited transfer | 2.2 | 2.1 | 3.5 | 0.0 | 0.0 |
| Recurring transfer | 5.1 | 5.9 | 6.3 | 7.3 | 8.2 |
| Total transfer to reserve fund | 7.3 | 8.0 | 9.8 | 7.3 | 8.2 |
Based on the current capital cost estimates, the funding level for the Service Enhancement Strategy as outlined above is sufficient to cover the proposed capital plan and eliminate the deficit balance on the reserve fund. A summary of the 10-year reserve fund forecast is provided in Table 46.
| Description | 2023 | 2024 | 2025 | 2026 | 2027 | 2028 | 2029 | 2030 | 2031 | 2032 | 2033 |
|---|---|---|---|---|---|---|---|---|---|---|---|
| Opening balance | (2.7) | (0.7) | (3.8) | 2.0 | 3.5 | 4.6 | 0.4 | (1.6) | 0,2 | 3.8 | 7.1 |
| Transfers from operating | 7.3 | 8.0 | 9.8 | 7.3 | 8.2 | 9.0 | 10.0 | 11.1 | 11.7 | 12.3 | 13.0 |
| Interest earned | (0.0) | (0.0) | (0.0) | 0.0 | 0.1 | 0.0 | (0.0) | (0.0) | 0.0 | 0.1 | 0.1 |
| Capital expenditures | (5.3) | (11.1) | (4.0) | (5.8) | (7.2) | (13.2) | (12.0) | (9.3) | (8.1) | (9.0) | (11.4) |
| Closing balance | (0.7) | (3.8) | 2.0 | 3.5 | 4.6 | 0.4 | (1.6) | 0.2 | 3.8 | 7.1 | 8.8 |
Brownfield Renewal Strategy
The Brownfield Renewal Strategy (formerly Contaminated Sites Strategy) funds activities required to monitor and clean up environmental contamination at City-owned sites. The strategy funds projects related to monitoring, investigation, and risk assessment in addition to site remediation. As noted in the budget manual, the goal of this strategy is to reduce the contaminated sites liability to less than $5 million over the next 10 to 25 years.
Through previous budgets, Council built annual transfers to the reserve fund for this strategy to $3.1 million – $2.1 million from property taxes, and $500,000 from each of water and wastewater rates. As part of the 2024-2027 multi-year budget process, funding from property taxes will be maintained, with inflationary increases each year. Annual funding from water and wastewater rates will be maintained at $500,000 from each service with no inflationary increases assumed for the 10-year period to 2033 due to affordability concerns. Details underlying the annual transfers for 2023 and the four-year period to 2027 under this strategy are presented in Table 47 below.
| Funding source | 2023 | 2024 | 2025 | 2026 | 2027 |
|---|---|---|---|---|---|
| Tax | 2.1 | 2.2 | 2.3 | 2.3 | 2.4 |
| Water | 0.5 | 0.5 | 0.5 | 0.5 | 0.5 |
| Wastewater | 0.5 | 0.5 | 0.5 | 0.5 | 0.5 |
| Total transfer to reserve fund | 3.1 | 3.2 | 3.3 | 3.3 | 3.4 |
The capital projects funded from this revenue source included in the 10-year capital plan are mostly for studies, limited remediation, and monitoring. Capital projects for the actual clean-up/remediation and/or environmental risk assessments of the sites will need to be added to the capital plan once the study and limited remedial work is complete. The strategy, as described above, is sufficient to fund the capital projects identified in the 10-year capital plan under the brownfield renewal program of work. It will ensure a positive balance in the reserve fund to fund the additional projects to meet the current liability, valued at $31.8 million at the end of 2022. A summary of the 10-year reserve fund forecast is provided in Table 48.
| Description | 2023 | 2024 | 2025 | 2026 | 2027 | 2028 | 2029 | 2030 | 2031 | 2032 | 2033 |
|---|---|---|---|---|---|---|---|---|---|---|---|
| Opening balance | 11.7 | 6.6 | 7.4 | 10.0 | 11.9 | 14.0 | 16.4 | 19.6 | 22.8 | 26.3 | 29.8 |
| Transfers from operating | 3.1 | 3.2 | 3.3 | 3.3 | 3.4 | 3.5 | 3.5 | 3.6 | 3.7 | 3.8 | 3.9 |
| Interest earned | 0.1 | 0.1 | 0.1 | 0.2 | 0.2 | 0.2 | 0.3 | 0.3 | 0.4 | 0.4 | 0.5 |
| Capital expenditures | (8.3) | (2.5) | (0.8) | (1.6) | (1.5) | (1.3) | (0.6) | (0.7) | (0.6) | (0.7) | (1.5) |
| Closing balance | 6.6 | 7.4 | 10.0 | 11.9 | 14.0 | 16.4 | 19.6 | 22.8 | 26.3 | 29.8 | 32.6 |
The City is implementing Public Sector Accounting Standards PS 3280 – Asset Retirement Obligations (PS 3280). This accounting standard has a broader application than the current Contaminated Sites and Landfill Post-Closure accounting standards which underlie the City’s current liability. Staff will report to Council on the liability impact and potential changes to this funding strategy after the PS 3280 standard is fully implemented in the City’s financial statements for the year ending December 31, 2023.
100 Per Cent Renewable Energy Strategy
The 100 per cent Renewable Energy (100RE) strategy funds projects that reduce emissions and supports Guelph’s Race-to-Zero goal to become a net-zero carbon community by 2050.
The City’s Corporate Energy and Climate Change team provided an overview of interim targets for 2026 and 2030 and an overview of focus projects for City emissions reductions as well as City supports for community reductions as outlined in Information Report 2022-223 – Cities Race-to-Zero Four-Year Interim Targets published in June 2022. There are two main project categories included in the 10-year capital budget and forecast to advance toward these objectives, listed as executing in Table 49 below. There are two other projects in the initial planning and discovery phase which, if moved forward, would also have a significant impact on the City’s progress toward Guelph’s Race-to-Zero and 100 per cent renewable energy objectives.
| Focus projects | Capital project number | Project status and resourcing | Estimated emissions reduction |
|---|---|---|---|
| Guelph Transit electrification | TC0064 TC0070 TC0077 TC0087 TC0089 TC0090 |
Executing | 6,700 tCO2e |
| Anaerobic digestion upgrades at Organic Waste Processing Facility to produce renewable natural gas | WC0048 | Initial planning | 3,000 to 5,000 tCO2e |
| Water Resource Recovery Centre upgrade to produce renewable natural gas (rate funded) | ST0009 | Initial planning | 2,000 to 3,000 tCO2e (10-15%) |
| 100RE initiatives | GG0261 | Executing | Varies by project (reported on annually through Environmental Sustainability Report) |
Through previous budgets, Council approved annual transfers from property taxes to the 100RE reserve fund of $2.7 million in 2023 and increasing to $8.2 million in 2029. Annual transfers for 2030 to 2032 would also have been $8.2 million per previous forecasts. Based on the 10-year capital plan, these approved transfers would not be sufficient to fund the projects identified as “executing” in the table above.
Annual inflationary increases to the approved annual transfer will be applied to mitigate the pressures on the 100RE reserve. In addition, the transfer is proposed to increase by $1.1 million, on average, for the years 2025 through 2027. Table 50 presents the annual capital funding transfer from property taxes to the 100RE reserve fund for the four-year budget period to 2027.
| Funding source | 2023 | 2024 | 2025 | 2026 | 2027 |
|---|---|---|---|---|---|
| Tax | 2.7 | 3.4 | 5.5 | 7.8 | 10.1 |
Table 51 summarizes the reserve fund forecast for 2023 to 2033. Despite the increases discussed above, negative reserve fund balances are forecasted for 2024 to 2033. The negative balances are largely a result of funding the transit share of the Guelph Transit and Fleet Services Facility (ICIP-GUE-03), project number TC0087, in 2026 and 2027 as well as funding the annual debt payments for the projects, which are expected to start in 2030. Staff are currently refining the scope of this project and funding strategy for this work, and this will be updated as part of the 2025 budget confirmation process.
Funding for the other projects required to meet Guelph’s Race-to-Zero and 100RE goals for which initial planning and feasibility analysis is underway will be explored as the business cases are developed and will be factored into future multi-year budgets if these projects move forward. These projects are not currently included within the ten-year capital budget and forecast, and may not rely on funding from the 100RE strategy (i.e., Water Resource Recovery Centre upgrade to produce renewable natural gas).
Staff will continue to explore and pursue grant opportunities that can be used to fund these initiatives as they become available. If successful, this external funding could help improve the overall status of the reserve fund and reduce the need for increased tax support for the reserve fund.
| Description | 2023 | 2024 | 2025 | 2026 | 2027 | 2028 | 2029 | 2030 | 2031 | 2032 | 2033 |
|---|---|---|---|---|---|---|---|---|---|---|---|
| Opening balance | 5.5 | 0.5 | (0.6) | (0.2) | (7.8) | (4.1) | (11.3) | (6.3) | (4.2) | (6.9) | (5.0) |
| Transfers from operating | 2.7 | 3.4 | 5.5 | 7.8 | 10.1 | 11.4 | 12.8 | 13.2 | 13.6 | 14.0 | 14.4 |
| Interest earned | 0.0 | 0.0 | 0.0 | (0.1) | (0.1) | (0.1) | (0.1) | (0.1) | (0.1) | (0.1) | (0.1) |
| Capital expenditures | (7.8) | (4.4) | (5.1) | (15.4) | (6.3) | (18.5) | (7.7) | (11.0) | (16.2) | (1.9) | (12.1) |
| Closing balance | 0.5 | (0.6) | (0.2) | (7.8) | (4.1) | (11.3) | (6.3) | (4.2) | (6.9) | (5.0) | (2.7) |