The 2022/23 budget is a reflection of the resources required to meet our service delivery requirements to both our current and future population: residents and businesses. Further, it includes a number of strategic investment options required to implement the Strategic Plan priorities and demonstrate improvement on the Council-approved performance metrics. The budget is the tool for setting the pace of achieving these goals through demonstration of the operating budget financial impact over a four-year period.
Overriding themes and strategies have emerged from the development of the 2022/23 Budget and will be reinforced through all aspects of the presentation and documents:
long-term financial planning provides the foundation to inform data driven decisions, to prioritize investment aligned with capacity to delivery and to maintain an affordable pace of service delivery
the COVID-19 Pandemic recovery continues to create uncertainty in future with changing business needs, supply chain challenges, significant inflationary concerns and reliance on Provincial grant funding
digital transformation is needed to become the modern and customer-centric City our community expects
Climate change is happening around us and the City is responding by applying a climate lens across everything we do including capital lifecycle replacements, new construction, and energy optimization initiatives.
Not only is legislation mandating that Guelph grows, but it’s also changing a number of our businesses operating landscapes; the multi-year budget enables an agile forecast to plan and respond to these changes
The total 2022/23 operating expenditure budget is $485.6 million and $506.1 million respectively; investment is focused on maintaining service delivery to our current and growing population. The 2022 and 2023 capital budgets total $141.4 million and $161.9 million respectively, and primarily focus on infrastructure renewal of our aging assets and building infrastructure to support our growing City.
Overall, the key achievements included in the City’s multi-year budget investment are:
Just under 15km of fibre-optic cabling installed readying the City for future data and network needs.
Investing in renewable energy to fund the electrification of 35 aged conventional transit fleet buses over eight years, significantly reducing the City’s carbon footprint.
Delivery of 10 trail connectivity solutions throughout 2022 and 2023.
Improved completion time (6 to 12 months) of low/medium priority forestry work versus current two-year timeline.
Planting of 10,000 trees in each of 2022 and 2023, in partnership with our local stakeholders.
Making our roads safer through implementation of the Community Road Safety Strategy, approval of speed limit reductions, and implementing new technology like red light cameras and automated speed enforcement.
Recovery of City businesses significantly impacted by COVID including the reimplementation of the transit U-pass contract and planned programming of cultural and recreation facilities.
City programming of the Guelph Sports Dome expands to multi use, year-round sport and facility access for all ages.
Delivering more timely processing of development applications and building inspections in accordance with changing legislation.
Responding to above-average inflationary pressures with the help of the City’s strong reserve position, recognizing the excellence in past efforts to build reserves and focus on cost-containment through COVID.
Continued focus on maintaining critical City infrastructure to deliver services to the community; implementing the Capital Program Resourcing Strategy which builds people capacity over five years to double the City’s capital spending and project execution in accordance with the Asset Management Plan.
Responding to our growing community while maintaining our service levels with the addition of a tandem sand/salter truck, a mobility bus and a waste packer.
Developing business cases where required to assess viability of Service Rationalization Review opportunities.
Approval of the Transit Route Review which will increase ridership over 13 years to 10.4 million or a mode share of 13 percent by 2031.
Approval of the 2022/23 Paramedic Services Master Plan resourcing needs to meet the predicted increases in call volumes and service demands.
Approval of investment in digital services and customer services to assist the City in achieving the service, performance, and financial benefits of digital service transformation.
Approval of increased Community Benefit Agreement allotments for Guelph Humane Society and Guelph Neighbourhood Support Coalition.
Approval of Cultural Heritage Action Plan resourcing to address capacity issues and deliver on council approved actions
Approval of a pilot project for a three-tier subsidy program for transit as well as approval of a “kids ride free” transit program beginning in March.
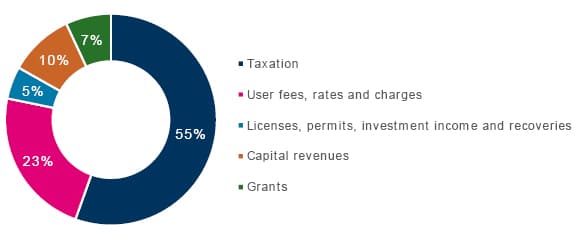
The operating and capital budgets are funded by different revenue streams, including property taxes, user fees, rates, grants, development charges and investment income. The following chart shows the total revenues that fund the combined operating and capital budgets in 2022. Property taxes fund just over half of the City’s budget, meaning other revenue sources are just as important when we consider the delivery of all services.
2022 total revenues by type
View data
Revenue type
Amount
Percentage
Taxation
(284,351,153)
56%
User Fees, rates and charges
(115,744,915)
23%
Licenses, permits, investment income and recoveries
(26,523,249)
5%
Capital revenues
(49,384,370)
10%
Grants
(34,167,724)
7%
The budget is the tool which is used to generate the required revenue needed to fund the cost of delivering services to the community. The revenue increases for taxes and user rates required to fund the budget over four years are included in the table below. The City also has many user fees and charges that are increasing with inflation and reducing the amount otherwise required from taxation.
Levy Type
2022
2023
2024
2025
Tax levy – City
2.78%
3.35%
4.42%
3.54%
Tax levy – Local board and shared services
1.43%
1.82%
1.15%
1.68%
Tax levy – Guelph General Hospital
0.00%
n/a
0.25%
n/a
Total tax levy increase
4.21%
5.17%
5.82%
5.22%
User rate increase
2.61%
2.73%
3.45%
2.84%
Highlights from the 2022/23 budget
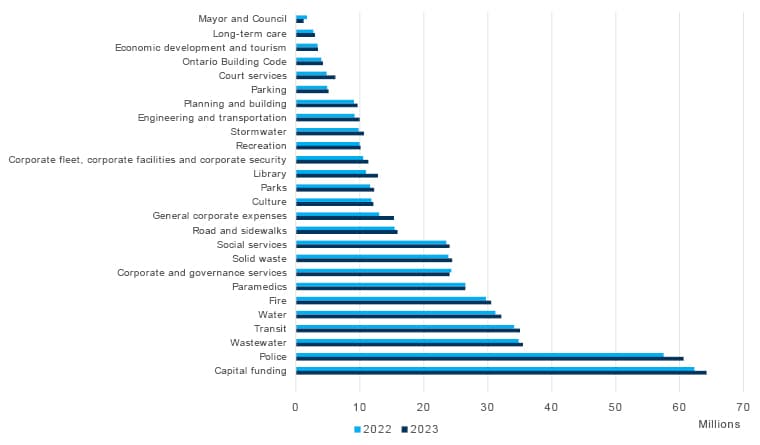
In aggregate, the total cost of each service for 2022 and 2023 shows the total operating investment excluding any revenues. This provides context to the magnitude of each service cost in comparison to each one another, it is not however reflective of the property tax cost. Capital funding as depicted only includes the tax supported businesses, as the City works on improved ways to visualize total cost of service in the future. The water, wastewater, stormwater, courts services, parking services, police, library, long-term care, public health, and social services include the capital cost of service in their respective lines.
2022/2023 gross expenditure by service
View data
Service
2022 (in millions)
2023 (in millions)
Mayor and Council
1.17
1.20
Long-term care
2.73
2.97
Economic development and tourism
3.40
3.44
Ontario Building Code
3.95
4.20
Court services
4.77
6.14
Parking
4.98
5.12
Planning and building
9.07
9.61
Engineering and transportation
9.15
9.96
Stormwater
9.80
10.6
Recreation
9.94
10.1
Corporate fleet, corporate facilities and corporate security
10.5
11.3
Library
10.9
12.8
Parks
11.6
12.2
Culture
11.8
12.1
General corporate expenses
13.0
15.3
Road and sidewalks
15.4
15.9
Social services
23.5
24.0
Solid waste
23.8
24.4
Corporate and governance services
24.3
24.0
Paramedics
26.5
26.5
Fire
29.7
30.5
Water
31.2
32.1
Transit
34.1
35.0
Wastwater
34.8
35.5
Police
57.5
60.6
Capital funding
62.3
64.2
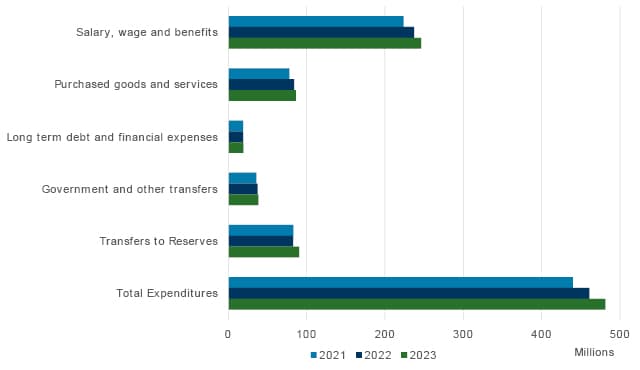
The operating budget can also be considered by type of expense rather than by service. From this perspective, it becomes clear why we value our employees in this organization as they represent the most critical and significant input to delivering the services we provide to the community.
Operating expenses by type
View data
Year
2021
2022
2023
Salary, wage and benefits
223,852,924
237,333,583
246,343,367
Purchased goods and services
77,996,869
84,021,894
86,488,409
Long term debt and financial expenses
18,798,814
19,090,350
19,265,350
Government and other transfers
35,971,300
37,630,521
38,506,641
Transfers to Reserves
83,069,540
82,710,693
90,665,990
Total Expenditures
439,689,447
460,787,041
481,269,757
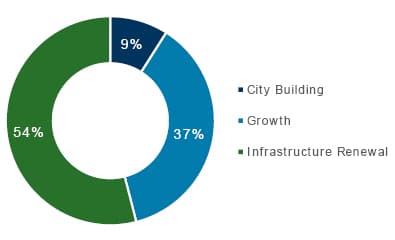
Transitioning to the capital budget, the City is projecting to spend $2.04 billion over the next ten years and this work can be categorized into the following priority areas. Infrastructure Renewal remains the largest focus followed by growth-related capital investment supporting the mandated requirement for our population to grow to over 200,000 people by 2051.
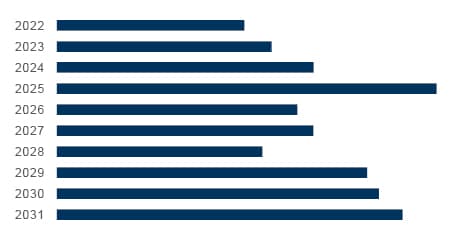
From an investment by year perspective, the capital budget can be quite variable as the size and complexity of projects each year can be vastly different. A new facility for example, can cause a variation in one year over another that is more focused on linear road and underground pipe infrastructure renewal. The City’s integrated infrastructure planning crosses a number of departments and asset management plans drive the majority of capital decisions.
Capital budget investment by year
View data
Year
Capital budget investment
2022
141,423,650
2023
161,907,150
2024
193,632,450
2025
286,120,350
2026
181,305,750
2027
193,362,850
2028
155,080,800
2029
233,826,400
2030
242,787,140
2031
260,475,600
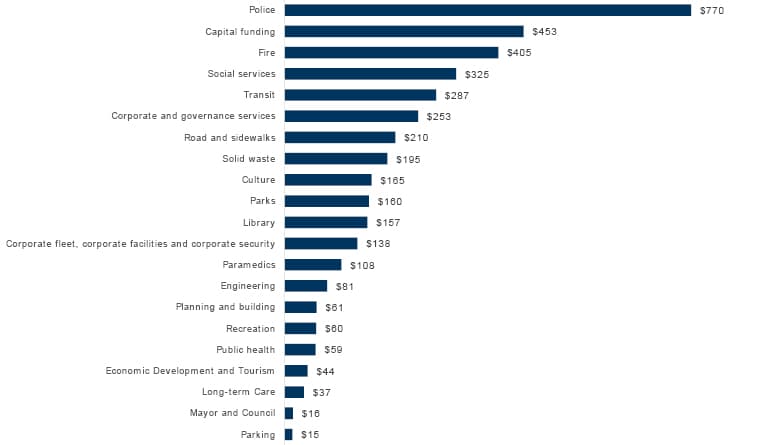
Finally, new this year, we wanted to provide a more detailed look at what each service costs to the property taxpayer annually. The average residential property valued at $389,500 is estimated to pay $4,007.47 in property taxes in 2022 based on the approved budget, an increase of $153.77 over 2021 or about $12.81 per month. From a property tax bill perspective, the average homeowner payment is divided as follows:
2022/23 average property tax cost by service
View data
Service
Percentage
Average cost per service
Police
19.2%
$770
Capital funding
11.3%
$454
Fire
10.1%
$406
Social services
8.1%
$326
Transit
7.2%
$288
Corporate and governance services
6.3%
$253
Road and sidewalks
5.3%
$211
Solid waste
4.9%
$195
Culture
4.1%
$165
Parks
4.0%
$160
Library
3.9%
$157
Corporate fleet, corporate facilities and corporate security
3.4%
$138
Paramedics
2.7%
$109
Engineering
2.0%
$81
Planning and building
1.5%
$62
Recreation
1.5%
$61
Public health
1.5%
$59
Economic Development and Tourism
1.1%
$44
Long-term Care
0.9%
$38
Mayor and Council
0.4%
$16
Parking
0.4%
$15
2022 gross expenditures and funding sources (thousands)
Operating funding
Funding source
Funding
Taxation
286,644.7
User fees
115,893.0
Product sales/licence
7,514.0
Interest and penalties
8,023.8
External recoveries
11,216.5
Grants
34,167.7
Reserve transfers
22,206.9
Total operating funding
485,666.6
Capital funding
Funding source
Funding
Grants and subsidies
16,379.9
Development charges
24,829.7
Rate funding
54,889.9
Tax funded
43,367.5
Other
1,963.7
Total capital funding
141,430.7
Expenditures by pillar
Pillar
Operating expenditures
Capital expenditures
Total gross expenditures
Building our Future
258,762.8
27,168.1
285,930.9
Navigating our Future
43,218.3
34,067.3
77,285.6
Powering our Future
17,903.4
1,750.0
19,653.4
Sustaining our Future
127,305.6
72,607.2
199,912.8
Working Together for our Future
38,476.5
5,838.1
44,314.6
Gross expenditures
485,666.6
141,430.7
627,097.3
2022/23 proposed budget to approved and 2024/25 proposed forecast to approved forecast
Net Property Tax Levy and Payment in Lieu of Taxes
274,605,167
3.59%
291,875,868
4.35%
311,370,039
4.85%
330,556,674
4.45%
Budget changes – from proposed
hanges
Net levy requirement $
2022 Levy impact
2023 Net levy requirement $
2023 Levy impact
2024 Net levy requirement $
2024 Levy impact
2025 Net levy requirement
2025 Levy impact
Reduce City Building funding for digital services and customer service Strategy
(109,000)
(0.04%)
n/a
0.00%
n/a
0.00%
n/a
0.00%
Reduce Transfer to Capital Growth Reserve Fund
(500,000)
(0.19%)
n/a
0.00%
n/a
0.00%
n/a
0.00%
Phase-in Strategic City Building Investment to fund the Guelph Neighbourhood Support Coalition
(150,000)
(0.06%)
150,000
0.05%
n/a
0.00%
n/a
0.00%
Increase hourly parking rate from $2.18 to $2.66 per hour
(93,100)
(0.04%)
n/a
0.00%
n/a
0.00%
n/a
0.00%
Reduce Library budget increase
(100,000)
(0.04%)
n/a
0.00%
n/a
0.00%
n/a
0.00%
Apply the excess growth assessment
(500,000)
(0.19%)
500,000
0.18%
n/a
0.00%
n/a
0.00%
Reduce the phase-in budget for Baker District and South End Community Centre
(500,000)
(0.19%)
n/a
0.00%
500,000
0.17%
n/a
0.00%
Pilot program for kids free transit
125,000
0.05%
(125,000)
(0.04%)
n/a
0.00%
n/a
0.00%
Pilot program for kids free transit reserve funding
(125,000)
(0.05%)
125,000
0.04%
n/a
n/a
n/a
n/a
A one-time investment for the Welcoming Streets Program
91,000
0.03%
(91,000)
(0.03%)
n/a
0.00%
n/a
0.00%
Welcoming Streets Program reserve funded
(91,000)
(0.03%)
91,000
0.03%
n/a
n/a
n/a
n/a
A one-time investment for the Court Support Worker
50,000
0.02%
(50,000)
(0.02%)
n/a
0.00%
n/a
0.00%
Court Support Worker reserve funded
(50,000)
(0.02%)
50,000
0.02%
n/a
n/a
n/a
n/a
PIN Network volunteer check
120,000
0.05%
(120,000)
(0.04%)
n/a
0.00%
n/a
0.00%
PIN Network volunteer check funded from reserve
(120,000)
(0.05%)
120,000
0.04%
n/a
n/a
n/a
n/a
Minimum wage absorbed through gapping
(130,000)
(0.05%)
n/a
0.00%
n/a
0.00%
n/a
0.00%
Co-op Students for planning
80,000
0.03%
(80,000)
(0.03%)
n/a
0.00%
n/a
0.00%
Co-op Students for planning funded from reserve
(80,000)
(0.03%)
80,000
0.03%
n/a
0.00%
n/a
0.00%
Parking user fees increase of 5% to be exclude Norwich and Arthur
2,000
0.00%
n/a
0.00%
n/a
0.00%
n/a
0.00%
Library funding added back
99,999
0.04%
n/a
0.00%
n/a
0.00%
n/a
0.00%
Reduce transfer to contaminated sites
(500,000)
(0.19%)
n/a
0.00%
n/a
0.00%
n/a
0.00%
Paramedic Master Plan
384,800
0.15%
24,200
0.01%
(170,200)
(0.06%)
375,150
0.12%
Paramedic Master Plan funded from reserve
(192,400)
(0.07%)
192,400
0.07%
n/a
n/a
n/a
n/a
Emerging Technologies Office – Analyst
0
0.00%
n/a
0.00%
n/a
0.00%
n/a
0.00%
Transit – Route Review Operating Impacts
3,331,360
0.67%
1,257,690
0.45%
1,897,500
0.64%
2,115,500
0.67%
Community Investment – Subsidy Program Pilot
385,000
0.15%
(385,000)
(0.14%)
n/a
0.00%
n/a
0.00%
Funded from Tax Contingency Reserve
(385,000)
(0.15%)
385,000
n/a
n/a
n/a
n/a
n/a
Cultural Heritage Action Plan Resourcing FTE
116,600
0.04%
(2,400)
(0.00%)
n/a
0.00%
122,900
0.04%
Cultural Heritage Action Plan Resourcing
380,000
0.14%
(255,000)
(0.09%)
(123,400)
(0.04%)
n/a
n/a
Cultural Heritage Action Plan Resourcing funded from reserve
(380,000)
(0.14%)
255,000
0.09%
125,000
0.04%
n/a
n/a
Community Investment – CBA increase GNSC
246,600
0.09%
n/a
0.00%
n/a
0.00%
n/a
0.00%
Community Investment – CBA – Guelph Humane Society
150,000
0.06%
n/a
0.00%
n/a
0.00%
n/a
0.00%
Information Technology enhancements
87,200
0.03%
180,500
0.06%
(87,200)
(0.03%)
(180,500)
(0.06%)
Approved budget
279,719,226
5.52%
296,975,450
6.17%
316,481,493
6.57%
336,154,539
6.22%
Less assessment growth
(3,470,000)
(1.31%)
(2,797,192)
(1.00%)
(2,969,755)
(1.00%)
(3,164,815)
(1.00%)
Total approved property tax levy and payment in lieu of taxes (By-Law)
279,719,226
4.21%
296,975,450
5.17%
316,481,493
5.57%
336,154,539
5.22%
Guelph General Hospital outside of levy
750,000
0.28%
750,000
0.28%
n/a
0.00%
n/a
0.00%
Use reserves for hospital levy
(750,000)
(0.28%)
(750,000)
(0.28%)
750,000
0.25%
n/a
0.00%
2023 confirmed budget
In December 2021, Council approved the City’s first multi-year budget (MYB), covering the years 2022 and 2023. The 2023 budget confirmation is the City’s first and only confirmation year in this two-year MYB cycle. The Municipal Act requires that if a municipality passes a MYB, they must “readopt” the budget for every second or subsequent year, either in the year that the budget applies, or in the preceding year. The budget confirmation process, which includes reviewing, updating, and confirming the budget, is the mechanism for readoption in the City’s Budget Policy.
The overriding themes and strategies that emerged from the development of the approved 2023 budget included the COVID-19 pandemic, pace and capacity, changing legislation, modernizing and transforming the way we deliver services, and making energy and climate change reduction impacts. These key themes continue to influence the 2023 budget update. Since the 2023 budget’s creation in 2021, the COVID-19 theme has evolved from local response and recovery to larger global pressures that have informed additional themes that underlie the 2023 confirmed budget:
Significant pricing challenges related to inflation on the acquisition of goods and services, are impacting both the operating and capital budgets.
Supply chain challenges are causing longer than normal lead times resulting in delays in deliveries, as well as increased prices of inputs, products and supplies.
The emerging competitive post-pandemic labour market is causing labour shortages across many of the City’s departments.
Higher interest rates implemented by the Bank of Canada to combat inflation may result in the economic decline in 2023.
Operating budget
Adjustments were made to the operating budget in alignment with the City’s Budget Policy within the following categories:
In-year Council approvals
Legislative changes
Other 2023 updates
The total confirmed 2023 operating expenditure budget is $509.2 million.
2023 confirmed gross operating expenditures and funding sources ($ thousands)
Expenditures
2023 approved budget
2023 confirmed budget
2023 change
Salary, wage and benefits
250,268.2
254,833.2
4,564.9
Purchased goods and services
87,659.0
88,159.9
500.9
Long term debt and financial expenses
19,265.4
19,264.7
(0.8)
Government and other transfers
38,858.2
39,806.2
948.0
Transfers to reserves
110,123.1
107,088.2
(3,034.9)
Total expenditures
506,173.9
509,152.1
2,978.2
Funding source
2023 approved budget
2023 confirmed budget
2023 change
Taxation
304,050.9
302,958.0
(1,092.9)
User fees
121,110.5
121,489.9
379.4
Product sales/license
7,759.5
7,756.8
(2.7)
Interest and penalties
8,025.1
5,394.4
(2,630.7)
External recoveries
11,416.9
12,378.1
961.2
Grants
33,974.5
34,504.5
530.0
Transfers from reserves
19,836.4
24,670.4
4.834.0
Total operating funding
506,173.9
509,152.1
2,978.2
2023 increase in net payments in lieu and property taxes to be levied
Change from 2022 to 2023 approved net property taxes and payments in lieu.
em
2023 approved net levy requirement ($)
2023 approved net levy impact
2022 net levy
279,280,030
n/a
2023 approved budget increase
17,256,224
6.17%
Assessment growth
(2,797,192)
(1.00%)
Net property tax and payments in lieu of taxes to be levied
14,459,032
5.17%
Adjustments to approved 2023 budget included in 2023 confirmed budget
In-year Council approvals
n-year council approvals
2023 confirmed levy requirement ($)
2023 confirmed levy impact
Municipal Accommodations Tax
171,910
0.06%
Municipal Accommodations Tax, funded from Tourism reserve
(171,910)
(0.06%)
Farmer’s Market transition to 10C
31,436
0.01%
Farmer’s Market transition to 10C funded from Tax Operating Contingency reserve
(31,436)
(0.01%)
Property Assessed Clean Energy (PACE) program, fully funded through Federation of Canadian
Municipalities (FCM) grant
0
0.00%
Mayor and Council salary
124,673
0.04%
Mayor and Council salary funded from Tax Operating Contingency reserve
(124,673)
(0.04%)
Bill 109 impacts
829,580
0.30%
Bill 109 portion funded from Tax Operating Contingency reserve
(556,000)
(0.20%)
Total in-year Council approvals
273,580
0.10%
Legislated changes
Legislated changes
2023 confirmed levy requirement ($)
2023 confirmed levy impact
Ontario Municipal Employees’ Retirement System (OMERS) employee eligibility adjustment
980,000
0.35%
OMERS employee eligibility adjustment funded from Compensation Contingency reserve
(980,000)
0.35%
Bill 23 impacts
1,000,000
0.36%
Bill 23 portion funded from Tax Operating Contingency Reserve
(500,000)
(0.18%)
Total legislated changes
500,000
0.17%
Other 2023 updates
Other 2023 updates
2023 confirmed levy requirement ($)
2023 confirmed levy impact
Investment in Paramedic Services resources (using provincial COVID funding for paramedics)
0
0.00%
Phase-in of South End Community Centre over additional year
(69,000)
0.02%
Phase-in of Baker District Redevelopment over additional year
(400,000)
0.14%
Non-union Municipal Employee (NUME) compensation adjustment
90,310
0.03%
NUME compensation adjustment funded from the Compensation Contingency reserve
(90,310)
(0.03%)
Offset transfer to Affordable Housing Reserve by the Tax Operating Contingency Reserve
(500,000)
(0.18%)
Kids Ride Free pilot program extension
138,911
0.05%
Kids Ride Free pilot program funded from Tax Operating Contingency Reserve
(138,911)
(0.05%)
Adoption of the Affordable Bus Pass sliding scale on an ongoing basis
458,000
0.16%
One-time capital investment related to Affordable Bus Pass sliding scale
100,000
0.04%
Adoption of the Affordable Bus Pass sliding scale and associated one-time capital investment funded
from the Tax Operating Contingency Reserve
(558,000)
(0.20%)
Annual contribution to the Welcoming Streets initiative
202,500
0.07%
Funding for Business Service Agencies Agreements
300,000
0.11
One-time investment in resources to address urgent homelessness, additions and mental health crisis
150,000
0.05%
One-time investment in resources to address urgent homelessness, addictions and mental health crisis
funded from the Tax Operating Contingency Reserve
(150,000)
(0.05%)
Reduction of the Infrastructure Renewal transfer
(1,400,000)
(0.50%)
Total other 2023 updates
(1,866,500)
(0.67%)
2023 increase in net payments in lieu and property taxes to be levied
2023 increase in net payments in lieu and property taxes to be levied
2023 confirmed levy requirement ($)
2023 confirmed levy impact
Total 2023 property tax levy and payment in lieu of taxes required
295,882,530
n/a
2023 increase in property tax and payments in lieu of taxes to be levied
16,163,304
5.78%
Less assessment growth
(3,685,000)
(1.32%)
Total property tax levy
n/a
4.46%
2023 confirmed user rates
Legislative impacts
2023 confirmed gross expenditures
2023 confirmed user rate impact
2023 approved budget increase
2,517,346
2.73%
Bill 23 impacts: water
300,000
0.33%
Bill 23 impacts: wastewater
300,000
0.33%
Bill 23 impacts: funded from transfer from rate-specific contingency reserves to rate-specific
capital reserves
(600,000)
(0.66%)
Non-union Municipal Employee (NUME) compensation adjustment (non-tax)
12,560
0.01%
NUME compensation adjustment funded from rate-specific contingency reserves
(12,560)
(0.01%)
Total confirmed budget
2,517,346
2.73%
Capital prioritization process
In response to high inflation impacting the City’s ability to deliver capital projects within their approved budgets, Council approved providing staff delegated authority to prioritize capital projects within the current approved capital expenditures budget until the approval of the 2024 capital budget.
A holistic review of the approved budgets was undertaken by staff in alignment with the prioritization criteria identified in the Inflationary Financial Impact Strategy report, to create financial capacity to deal with inflationary pressures. The capital prioritization process resulted in a $38.8 million net decrease to the approved 2023 capital budget, resulting in a confirmed 2023 capital budget update of $123.2 million.
2023 confirmed gross capital expenditures and funding sources ($ thousands)
Funding source
2023 approved budget
2023 confirmed budget
Grants and subsidies
23,675.0
17,323.0
Development charges
36,480.8
15,788.4
Rate funding
49,717.2
41,738.4
Tax-funded
51,152.0
47,245.6
Other
882.0
1,060.0
Total capital funding
161,907.2
123,155.5
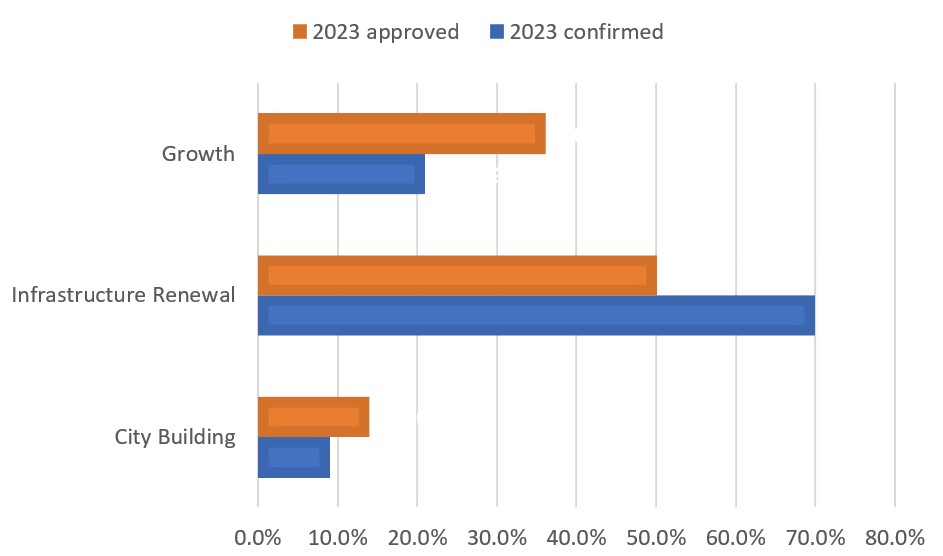
After the capital prioritization, the confirmed 2023 capital budget is now comprised of 70% infrastructure renewal (previously 64%), 21% growth (previously 25%), and 9% city building (previously 11%).
View data
Item
2023 approved
2023 update
Growth
36.0%
21.0%
Infrastructure Renewal
50.0%
70.0%
City Building
14.0%
9.0%
2023 Capital prioritization adjustments by funding type ($ thousands)
Funding type
2023 approved budget
2023 confirmed budget
2023 budget adjustment
City Building
22,398.4
10,990.4
(11,408.0)
Growth
57,156.8
25,405.8
(31,751.0)
Infrastructure Renewal
82,352.0
86,759.3
4,407.3
Grand total
161,907.2
123,155.5
(38,751.7)
2023 Capital prioritization outcome by strategic plan pillar ($ thousands)
Strategic plan pillar
2023 approved capital budget
Capital prioritization adjustment
2023 confirmed capital budget
Building our future
24,244.8
13,129.0
37,373.8
Navigating our future
48,011.1
(21,507.1)
26,504.0
Powering our future
1,150.0
(1,150.0)
0
Sustaining our future
83,949.3
(31,669.6)
52,279.7
Working together for our future
4,552.0
2,446.0
6,998.0
Grand total
161,907.2
(38,751.7)
123,155.5
2023 confirmed total budget summary
Total operating and capital expenditures by pillar ($ thousands)