On this page
The city of Guelph is growing from a current population of about 132,000 to a provincial growth target of 203,000 and 116,000 jobs by 2051. This will require significant infrastructure investments and will stretch the limits of our current ground water supply and wastewater effluent capacity.
Growth planning starts with the Official Plan and Municipal Comprehensive Review (MCR) that will inform where and how Guelph will grow. From there, the City develops service delivery master plans that assess where infrastructure is currently and what changes we will need to accommodate growth. Our funding models need to forecast the increased cost to deliver services in future years as well as the related revenues to fund the infrastructure costs as part of an overall financial strategy.
Growth impacts both capital and operating budget planning. The service master plans capture the capital investment required; however, growth is not just about capital investment, as growing infrastructure requires an increased operating budget to maintain that infrastructure and deliver services to the increased population.
Growth comes with specific funding sources that can be used to fund growth costs. These funding sources include:
Growth-operating revenues
- property tax assessment and utility rate growth
- user fee growth
- building permit fees
- planning and development application fees
Growth-capital revenues
- property tax assessment growth and utility rate growth
- development charges
- parkland dedication
- new community benefit charge to be considered in 2022
Over the past three years, as a City we have focused on talking about the “capital cost of growth.” We know that from this analysis, that development charges fund about 85 per cent of the total capital cost of growth. Changes to recent legislation may improve this ratio, which will be determined through the 2021 Development Charge Update, the 2022 Community Benefit Charge Bylaw updates and the 2023 Comprehensive Development Charge Background Study.
The City continues identify and communicate the operating costs of growth and develop strategies to manage this cost within the availability of growth-related operating revenues. In the future, a detailed Growth Funding Policy will be developed in order to support the principle “growth pays for growth” including a holistic view of growth revenues and costs. This policy, as well as the completion of growth-related funding studies will be a focus of the finance team through in 2022 and 2023.
COVID-19 has an impact on growth planning as there is uncertainty in the rate of growth, especially in the commercial and retail sector. A shift to a “work-from-home” culture will likely have impacts on the City’s infrastructure planning and financial models. The City’s healthy residential growth may be able to offset a potential non-residential decline with relatively little impact to long-range plans. Staff continues to review and consider these impacts through the Official Plan, Municipal Comprehensive Review and various service master plans that are underway.
Growth revenue assumptions in the 2022 to 2031 budget and forecast
- The City has projected one per cent property tax assessment growth annually in the 2022 to 2025 budget (the average assessment growth over the past four years was 1.5 per cent). The potential for lower-than-expected growth is possible due to the pandemic and availability of building materials, thus the slightly lower estimated growth of one per cent is fair based on the current climate.
- While 2020 building permits and development charge activity was trending at 60 per cent normal rate, the 2021 activity has increased significantly. 2021 year to date development activity is about 35 per cent higher than the same time in 2020.
- The budget assumes pre-COVID development charge collection rates through the 2022 to 2031 forecast period given market interest as people move out of the Greater Toronto Area with the expected societal shift to a “work-from-home” lifestyle.
- It is expected that the non-residential sector will remain sluggish in 2022 as that market is subject to more uncertainty. This could impact development charges and building permit revenue for 2022; however, the strong residential growth is likely to continue and offset this slow down.
- 2021 site plan applications are slightly below the five-year average; however, the sites are more complicated to review with an increased number of infill sites and higher density, again resulting in a strong residential growth forecast.
Growth-related capital projects in the capital budget and forecast
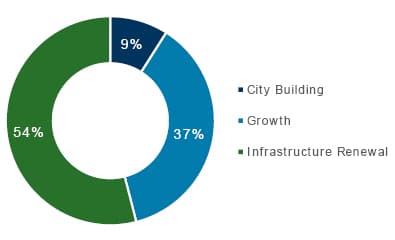
Growth is a primary driver of the budget and can be demonstrated through the proportionate share of the long-term capital plan. About 37 per cent or $741.3 million in capital spending is identified within the 10 years that increase the City’s infrastructure inventory to meet the demands of a growing community.
Notable 2022 to 2031 projects related to growth include:
- Continue new water supply exploration studies to support growth at Logan and Guelph South test wells (WT0002).
- Works related to Clair-Maltby Secondary Plan.
- Clair-Maltby Road Reconstruction (RD0372).
- Clair-Maltby Elevated Water Tower and Transmission Connection (WT0046).
- Clair-Maltby Pumping Stations (ST0030).
- Transit Route expansions (TC0064) pending Council approval of associated tax funding.
Growth paying for growth—an operating budget perspective
From an operating budget perspective, each year new properties are added to the tax roll creating an increase in property tax revenue called property tax assessment growth. The same is true in terms of the water, wastewater and stormwater rate models—there are growth revenues incorporated to account for a growing community. This revenue should be used to offset the additional costs of providing City services to new residents and businesses. Some operating costs are driven by the addition of assets such as facilities and buses, while others are driven by service requirements. These include maintaining response times to a growing population in all the emergency services or increasing staff requirements in the Planning and Building department because of increasing permit and applications being received.
While assessment growth tends to be fairly stable overtime, the incremental costs of growth vary from year to year depending on the types of expansions and the tipping point for needing the cost expansion.
The following table shows the City’s forecasted tax assessment growth over the next four years as well as the related growth expenditure increases. This table demonstrates that growth related revenue from assessment growth exceeds growth-related costs in 2022. This is the result of a $2 million reduction in reserve transfers to the Redevelopment Incentive Reserve.
For 2023 through 2025, there is a misalignment in timing of pressures related to growth, as the City phases in the impacts of Baker District and South End Community Centre. This continues to be an area of developing maturity in financial planning for improved methods of tracing and aligning the growth revenues and expenses. A Corporate Revenue Budget Policy, expected in 2022, will strengthen this matching ensuring growth revenues are used for growth expenses wherever possible.
City growth revenues and costs
| City growth revenues and costs | 2022 | 2023 | 2024 | 2025 |
|---|---|---|---|---|
| City Assessment Growth Available (net of allocation to Local Boards and Shared Services) | (2,324,900) | (1,874,119) | (1,989,736) | (2,120,426) |
| Assessment growth transferred to/(from) future year | $319,074 | ($319,074) | n/a | n/a |
Summary of City growth expense requests
| Growth expense requests | 2022 | 2023 | 2024 | 2025 |
|---|---|---|---|---|
| Tax Increment Based Grants reserve transfer (reduction) | (2,000,000) | n/a | n/a | n/a |
| Infrastructure Renewal growth-related capital transfer | 323,851 | 328,709 | 333,639 | 338,644 |
| Growth operating impact – Sustaining Our Future | 247,200 | 462,760 | 10,414 | 180,239 |
| Growth operating impact – Navigating our Future | 196,230 | 313,150 | 31,000 | 125,100 |
| Growth operating impact – Working together for our Future | 906,453 | 1,407,000 | 907,000 | 1,974,797 |
| Growth operating impact – Building our Future | 30,640 | 171,000 | 1,600 | 89,550 |
| Total estimated City growth expenses | (295,626) | 2,682,619 | 1,283,654 | 2,708,330 |
Net (available)/shortfall in growth revenues
| Net (available)/shortfall in growth revenues | 2022 | 2023 | 2024 | 2025 |
|---|---|---|---|---|
| Net (available)/shortfall in growth revenues | (2,301,452) | 489,426 | (706,082) | 587,904 |
2023 confirmed budget
Assessment growth revenue for the confirmed 2023 budget is 1.3 per cent or $3,685,000 which is $887,808 higher than originally budgeted. The updated table below reflects the continuing maturity in financial planning for improved alignment between growth revenues and growth expenses.
City growth revenues and costs
| City growth revenues and costs | 2022 approved budget | 2023 approved budget | 2023 confirmed budget | 2024 forecast | 2025 forecast |
|---|---|---|---|---|---|
| City Assessment Growth Available (net of allocation to Local Boards and Shared Services) | (2,324,900) | (1,874,119) | (2,468,953) | (1,989,736) | (2,120,426) |
| Assessment growth transferred to/(from) future year | $319,074 | ($319,074) | (319,074) | n/a | n/a |
| Total estimated City growth revenue | (2,005,826) | (2,193,193) | (2,788,027) | (1,989,736) | (2,120,426) |
Summary of City growth expense requests
| Growth expense requests | 2022 approved budget | 2023 approved budget | 2023 confirmed budget | 2024 forecast | 2025 forecast |
|---|---|---|---|---|---|
| Tax Increment Based Grants reserve transfer (reduction) | (2,000,000) | n/a | n/a | n/a | n/a |
| Infrastructure Renewal growth-related capital transfer | 323,851 | 328,709 | 328,709 | 333,639 | 338,644 |
| Growth operating impact – Sustaining Our Future | 247,200 | 462,760 | 462,760 | 10,414 | 180,239 |
| Growth operating impact – Navigating our Future | 196,230 | 313,150 | 313,150 | 31,000 | 125,100 |
| Growth operating impact – Working together for our Future | 906,453 | 1,407,000 | 1,407,000 | 907,000 | 1,974,797 |
| Growth operating impact – Building our Future | 30,640 | 171,000 | 171,000 | 1,600 | 89,550 |
| Total estimated City growth expenses | (295,626) | 2,682,619 | 2,682,619 | 1,283,654 | 2,708,330 |
Net (available)/shortfall in growth revenues
| Net (available)/shortfall in growth revenues | 2022 approved budget | 2023 approved budget | 2023 confirmed budget | 2024 forecast | 2025 forecast |
|---|---|---|---|---|---|
| Net (available)/shortfall in growth revenues | (2,301,452) | 489,426 | (105,408) | (706,082) | 587,904 |
Capital prioritization
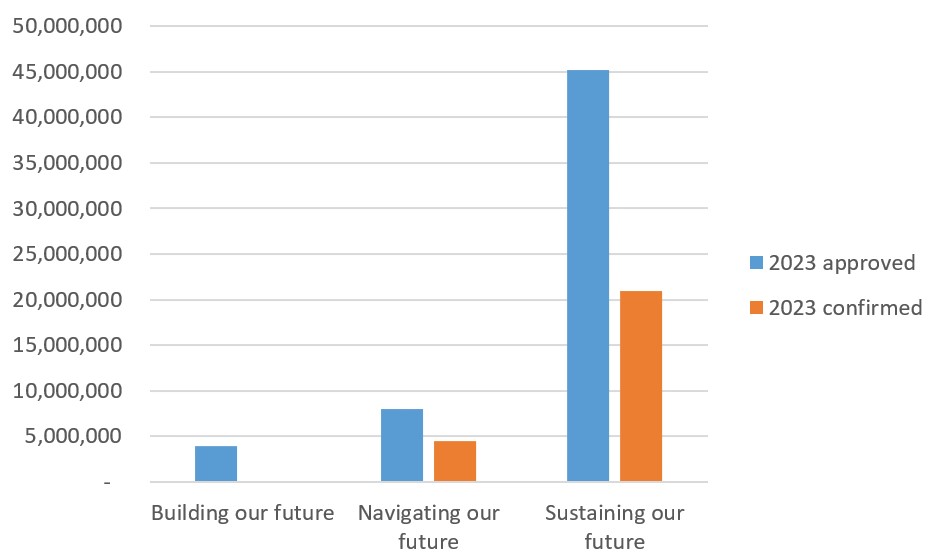
In accordance with the criteria outlined in Report 2022-118 Inflationary Financial Impact Strategy, staff completed a holistic review of the approved 2023 capital budget. This capital prioritization exercise resulted in a decrease of $31.8 million growth funded projects moving forward in 2023 compared to what was previously approved for the 2023 capital budget. The majority of the changes are in the Sustaining our future strategic plan pillar and focused on aligning project budgets with the timing of growth. Individual project changes can be found in the 2023 budget dashboard.
Figure 1 – Growth capital budget by strategic plan pillar
View Figure 1 data
| Strategic plan pillar | 2023 approved | 2023 confirmed |
|---|---|---|
| Building our future | 3,962,500 | 72,500 |
| Navigating our future | 7,955,300 | 4,444,300 |
| Sustaining our future | 45,239,000 | 20,889,000 |