On this page
The Municipal Act, 2001 allows municipalities to issue debt within limits for certain types of expenditures.
In accordance with the Debt Management Policy, the City uses debt to help achieve Strategic Plan objectives while keeping within legislative limits and the parameters of the Long-term Financial Framework.
Typically, debt is only issued for a project when it is substantially complete; however, with interest rates near historic lows, the debt market is currently very attractive. For this reason, staff issued about $49 million of early issue debt in 2021 in advance of construction of the South End Community Centre and the Baker District redevelopment. This allowed the City to issue debt at its lowest rate ever which creates taxpayer value for these City Building projects. In 2022, should favourable market conditions continue, and cash flow levels are appropriate, the City will look at potential further debt issues to take advantage of attractive rates.
The following chart shows the planned debenture issuances over the next 10 years. There are no new planned debt approvals included in the 2022 and 2023 budget.
2022 to 2032 Capital Debt Forecast (in millions)
| Project Description | 2022 | 2024 | 2026 | 2028 | 2030 | 2032 |
|---|---|---|---|---|---|---|
| South End Community Centre (approved in the 2021 and prior capital budget) |
$27.23 | n/a | n/a | n/a | n/a | n/a |
| Baker District – Main Library (approved in the 2021 and prior capital budget) |
$14.75 | n/a | n/a | n/a | n/a | n/a |
| Baker District – Planning and infrastructure (approved in the 2021 and prior capital budget) |
$10.00 | n/a | n/a | n/a | n/a | n/a |
| Baker District – Parkade (approved in the 2021 and prior capital budget) |
n/a | $13.00 | n/a | n/a | n/a | n/a |
| Operations Hub – Solid Waste Collections Operation Centre | n/a | $4.40 | n/a | n/a | n/a | n/a |
| Operations Hub – Transit Operations Facility | n/a | $34.30 | n/a | n/a | n/a | n/a |
| Water Services – FM Woods Station (approved in the 2021 and prior capital budget) |
n/a | $16.00 | n/a | n/a | n/a | n/a |
| Operations Hub – Fleet Repair Shop and Fueling Station | n/a | n/a | $32.00 | n/a | n/a | n/a |
| Operations Hub – Parks Operations Facility | n/a | n/a | n/a | $20.50 | n/a | n/a |
| Road Reconstruction – MacDonnell Street – Norfolk to Carden | n/a | n/a | n/a | $6.80 | n/a | n/a |
| Operations Hub – Administration Facility | n/a | n/a | n/a | n/a | $35.00 | n/a |
| Total Planned Debentures | $51.98 | $67.70 | $32.00 | $27.30 | $35.00 | $0.00 |
The City’s planned debt is within the annual limitations as prescribed by the province as well as the City’s Debt Management Policy. The chart below demonstrates the total debt outstanding each year compared to the City’s internal debt ceiling. There will be increased pressure on the City’s debt capacity in future years, but we expect to be well under the internal policy limit of 55 per cent of operating revenue.
Total Debt compared to Operating Revenue Limit
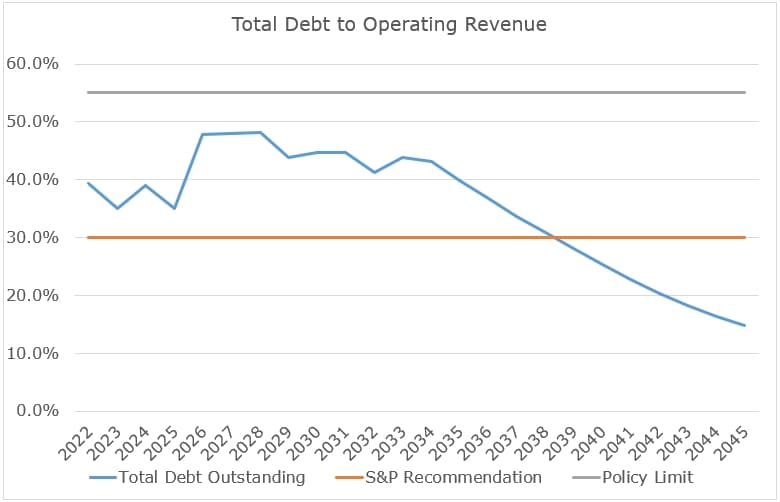
| Year | Total debt outstanding | S&P recommendation | Policy limit |
|---|---|---|---|
| 2022 | 39.3% | 30% | 55% |
| 2023 | 35% | 30% | 55% |
| 2024 | 39% | 30% | 55% |
| 2025 | 35% | 30% | 55% |
| 2026 | 48% | 30% | 55% |
| 2027 | 48% | 30% | 55% |
| 2028 | 48% | 30% | 55% |
| 2029 | 44% | 30% | 55% |
| 2030 | 45% | 30% | 55% |
| 2031 | 45% | 30% | 55% |
| 2032 | 41% | 30% | 55% |
| 2033 | 44% | 30% | 55% |
| 2034 | 43% | 30% | 55% |
| 2035 | 40% | 30% | 55% |
| 2036 | 37% | 30% | 55% |
| 2037 | 34% | 30% | 55% |
| 2038 | 31% | 30% | 55% |
| 2039 | 28% | 30% | 55% |
| 2040 | 25% | 30% | 55% |
| 2041 | 23% | 30% | 55% |
| 2042 | 20% | 30% | 55% |
| 2043 | 18% | 30% | 55% |
| 2044 | 16% | 30% | 55% |
| 2045 | 15% | 30% | 55% |
The final chart below demonstrates the cost to service the debt outstanding each year compared to the City’s revenues. You can see that the City is well below its debt capacity limits of 10 per cent of revenue.
Debt Servicing to Operating Revenue
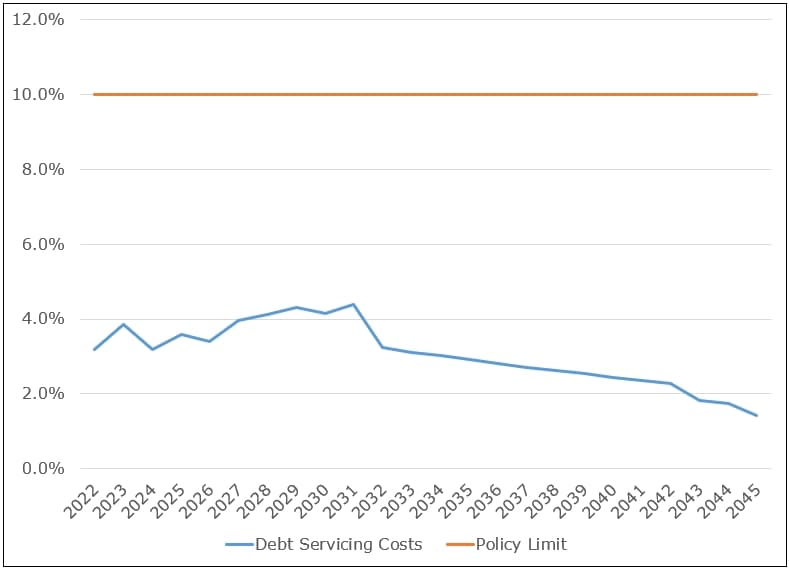
| Year | Debt servicing costs | Policy limit |
|---|---|---|
| 2022 | 3.2% | 10% |
| 2023 | 3.9% | 10% |
| 2024 | 3.2% | 10% |
| 2025 | 3.6% | 10% |
| 2026 | 3.4% | 10% |
| 2027 | 4.0% | 10% |
| 2028 | 4.1% | 10% |
| 2029 | 4.3% | 10% |
| 2030 | 4.2% | 10% |
| 2031 | 4.4% | 10% |
| 2032 | 3.2% | 10% |
| 2033 | 3.1% | 10% |
| 2034 | 3.0% | 10% |
| 2035 | 2.9% | 10% |
| 2036 | 2.8% | 10% |
| 2037 | 2.7% | 10% |
| 2038 | 2.6% | 10% |
| 2039 | 2.5% | 10% |
| 2040 | 2.5% | 10% |
| 2041 | 2.4% | 10% |
| 2042 | 2.3% | 10% |
| 2043 | 1.8% | 10% |
| 2044 | 1.8% | 10% |
| 2045 | 1.4% | 10% |
2023 confirmed budget
No new debt was issued in 2022 mainly due to interest rates increasing early in the year with central bank efforts to combat high inflation. City reserves and reserve funds are sufficient to delay the issuance of debt until 2024 or beyond, with the hope that interest rates will decline as inflation slows.
Over the longer term, the City’s use of debt will need to increase as the impacts of growth from recently approved Master Plans (MP) such as the Transportation Master Plan, Solid Waste Management Master Plan, 2021 Water Supply Master Plan, 2022 Wastewater Treatment and Biosolids Management Master Plan, and the Clair-Maltby Secondary Plan (CMSP) are incorporated, and the impacts of Bill 23 on infrastructure growth revenue sources are factored into the 25-year capital plan. The MPs and CMSP debt financing needs are due to the timing of major growth-driven infrastructure needs, such as wastewater plant and road network expansions to accommodate growth prior to the collection of development charges to pay for the capital investment. Bill 23 will have an impact because the level of growth over the next decade is now required to be significantly higher than planned. Additional infrastructure may be required sooner without the associated revenues being available at the same time. In addition, due to Bill 23, a significant portion of this work will now be tax and rate-funded due to the limitations on how much can be collected.
As part of the 2024-2033 capital plan review, an updated debt forecast will be developed and presented as part of the 2024-2027 Multi-Year Budget. This forecast will provide Council with a clearer picture of the constraints that debt capacity will put on the City’s ability to fund its overall capital plan, including growth, infrastructure renewal and city-building investments.