On this page
Macro-economic outlook
Canada’s economic recovery from the pandemic was stronger than expected but lingering issues with supply chains, labour markets and particularly high inflation have been the economic story of 2022. According to the Organisation for Economic Co-operation and Development (OECD), Canada’s real Gross Domestic Product (GDP) growth is projected to slow from 3.2 per cent in 2022 to 1 per cent in 2023 before strengthening to 1.3 per cent in 2024. The OECD cited higher borrowing costs and moderating export growth as factors contributing to this projection. Tight labour markets and inflation are also expected to ease with hiring declines resulting from slower output growth and supply bottlenecks clearing up. It’s expected that as inflation normalizes and hiring declines, increases in interest rates by the Bank of Canada will slow.
Guelph economic outlook
Standard & Poors (S&P) gave Guelph a very strong economic assessment based on its belief that the city’s economy supports Gross Domestic Product (GDP) per capita aligned with the national average and GDP growth aligned with Canada’s outlook. The strong local economy is propelled by the city’s growing population and diverse economy that is underpinned by a robust manufacturing sector and large public sector.
Employment growth
According to Statistics Canada, Canadian unemployment was at 5.1 per cent in November 2022 with a labour force participation rate of 64.8 per cent. The unemployment rate is approximately 0.9 per cent lower than average over the past 20 years and reflects extreme pressure in the labour market, while the participation rate is nearly 1.7 per cent lower than the 20-year average, providing possible insight into one of the drivers of the tight labour market.
Guelph’s employment rate tends to outperform the broader Canadian rate and the Guelph Census Metropolitan Area rate is estimated to be slightly below the national level of 5 per cent.
Interest rate environment
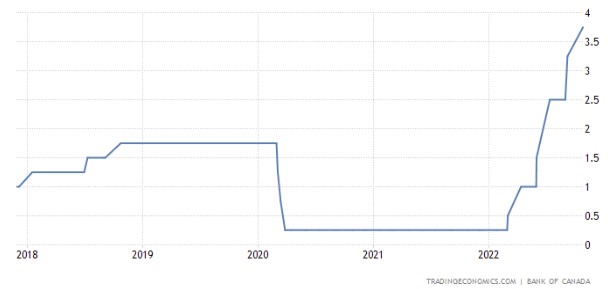
The Bank of Canada’s Policy Interest Rate forms the basis of what the market will pay for debt and investments. In March 2020 the Bank of Canada cut its Policy Interest Rate three times to respond the COVID-19, taking the target rate from 1.75 per cent down to 0.25 per cent.
In March 2022, the Bank of Canada began one of its most aggressive series of rate increases in recent memory. The bank has delivered seven consecutive rate increases since March 2022, raising the overnight from 0.25 per cent to 4.25 percent in less than one year (see figure 1).
Figure 1 – Historic Bank of Canada overnight rates 2018-2022
This affects the City of Guelph in two key areas:
- Borrowing: Rapidly increasing rates increase borrowing costs for debt-financed projects. The City does not have any debt issues planned for 2023 but debt will be required to support growth in the medium term. If interest rates remain elevated, this will have a negative impact as it will increase the interest costs of debt and increase the overall funding required for debt-funded capital projects.
- Investments: Rising interest rates increase the amount of investment income, since the rate of return on cash and investments is directly linked to interest rates. While improved interest rates impact interest earned on cash balances almost immediately, longer-term holdings take time to mature and cannot be reinvested to take advantage of rising rates without a capital loss. Over time this will increase the amount of investment income earned on the City’s operating cash and capital reserves.
Credit rating affirmed at AAA
A credit rating is an independent assessment of the risk of an organization of borrowing money and its ability to repay its debt. In May 2022, S&P global improved the institutional framework for municipalities. This resulted in an increase in the City’s credit rating from AA+ to AAA. During its formal review in September 2022, S&P global affirmed the best possible credit rating of AAA. This rating reflects the City’s commitment to long-term financial sustainability and the resilience of Guelph’s local economy.
S&P Global provided the following rationale for this rating, “Guelph’s booming population and diverse employment base should support the city’s economic and budgetary resilience through economic cycles. In addition, we expect that its prudent financial management and cost-containment efforts will help the city to continue generating robust operating surpluses in the next several years.”
S&P also highlighted the City’s budget processes in the rationale for the AAA credit rating, noting that “Guelph’s credit profile benefits from generally good political consensus in passing budgets without material delays and the city demonstrates effective revenue and expenditure planning practices. The city has begun preparing multiyear budgets and approved its first two-year operating budget in 2021, covering 2022 and 2023. In addition, Guelph plans to introduce a four-year operating budget in 2024 covering 2024-2027. Guelph has also begun to reinforce its capital projects team, resulting in increased capital spending this year and lower expected deferrals in the future. It is also undertaking a capital prioritization project to better inform its future capital plans.”
Inflationary cost pressures on the budget
Inflation is commonly defined as the general increase in prices for goods and services in an economy over a period of time. The Bank of Canada produces the monthly Consumer Price Index (CPI) that tracks changes in consumer prices.
Supply chains
COVID-19 has caused a massive disruption in global supply chains. Many factories were closed or reduced capacity due to lockdowns and have not returned to pre-pandemic levels. In other cases, factories shifted to making different products due to changes in demand during the pandemic and there can be a long lead time to shift production back. The transportation sector has also been disrupted with lower air traffic reducing the air cargo capacity, a shortage of truck drivers to haul goods, and increased regulation and backlogs at seaports.
All of these factors have combined increase the lead time and reduce the supply of many key components and has the ultimate effect of increasing prices for many of the materials that the City requires
Inflationary outlook
Consumer Price Index (CPI)
The latest inflationary data at time of writing was released in November 2022. At that time CPI was 6.9 per cent in October 2022 which was the same level as in September 2022. While this is down slightly from the near 30-year high of 8.1 per cent in June 2022, inflation is expected to remain high in 2022 and into 2023 until higher interest rates can have an effect.
This is the highest inflation rate in almost 40 years and is due to many factors. Low interest rates and government stimulus lead to a surplus of cash in the markets. Lockdowns reduced consumer spending on many goods and services and pent-up demand increased prices. This was coupled with supply chain issues and the war in Ukraine which all put upward pressure on prices.
Non-Residential Construction Price Index (NRCPI)
Another price index which may more closely match the municipal costs of goods and services, particularly in the capital budget, is the NRCPI. This index measures the change over time in contractors’ prices to construct new Industrial, Commercial, and Institutional buildings. The latest published NRCPI is reported quarterly and was 15.6 per cent for Q3 2022. This is the highest rate in recent memory and is approximately double the CPI.
NRCPI measures the costs of non-residential construction, and it is a better reflection of the pace of cost increases related to the City’s capital program. Development Charges are indexed to the NRCPI. This high rate puts significant pressure on the capital program as available capital funding does not keep pace with cost increases. This will have the effect of increasing the time to sustainable funding.
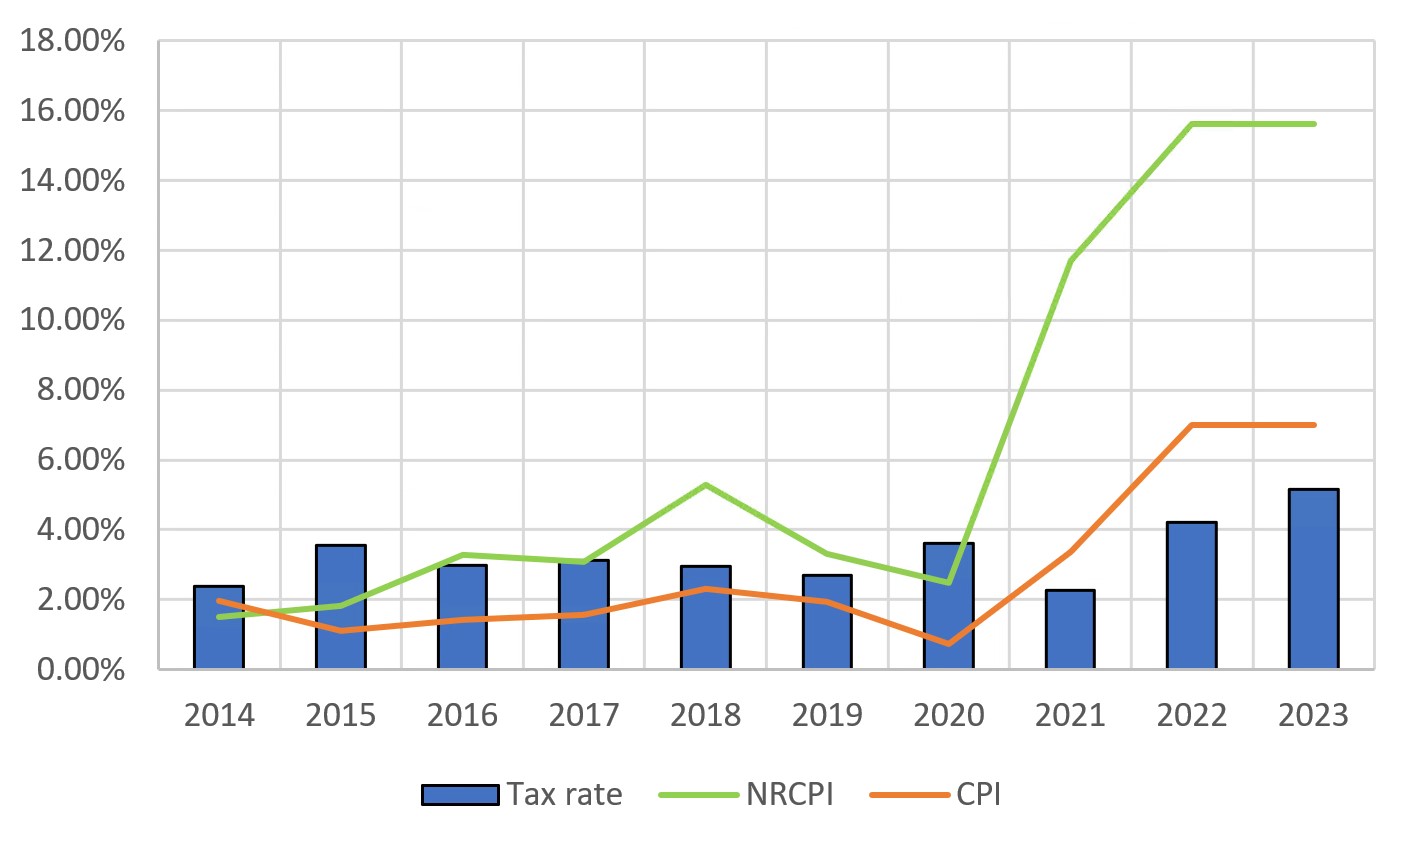
Figure 2 – Historic CPI and NRCPI rates compared with City of Guelph property tax increases
| Year | Tax rate | Non-Residential Construction Price Index (NRCPI) | Consumer Price Index (CPI) |
|---|---|---|---|
| 2014 | 2.38% | 1.5% | 2.0% |
| 2015 | 3.55% | 1.8% | 1.1% |
| 2016 | 2.99% | 3.3% | 1.4% |
| 2017 | 3.13% | 3.1% | 1.6% |
| 2018 | 2.95% | 5.3% | 2.3% |
| 2019 | 2.69% | 3.3% | 1.9% |
| 2020 | 3.60% | 2.5% | 0.7% |
| 2021 | 2.26% | 11.7% | 3.4% |
| 2022 | 4.21% | n/a | 7.0% |
| 2023 | 4.96% | n/a | 7.0% |
Annual inflationary increases generally raise the cost to do business. This is similar to annual increases consumers experience for groceries. These are the increased costs of delivering the same service or program to residents.
Historically the City’s tax rate increases have been above CPI, this is due to the increase including not just inflationary cost increases, but also expansion of service or increased investment in City Building and Infrastructure Renewal.
What are the City’s inflationary cost pressures?
- The largest component of inflationary pressure, representing 49 per cent of the total expenditure budget, is the salary, wages and benefits that are negotiated between the City and its workforce for a specified period of time. The City has six collective bargaining unions and one non-union management group. The City’s associated agencies and boards also have collective bargaining unions in their workforces like the Guelph Police Service and Guelph Public Library. Inflationary on compensation lags CPI as approximately 75 per cent of the City’s workforce is unionized (not including local boards) and wage increases are fixed in collective agreements.
- Paying utility bills for City-owned buildings and facilities—to keep the water running and lights on.
- Vehicle and equipment maintenance and fuel; the City has more than 1,200 fleet assets that are maintained including police cars, ambulances, fire trucks, transit buses, garbage collection packers, snowplows and bylaw vehicles. We need to keep these in good working order to deliver service to the community.
- Many of the materials and supplies used by the City are construction or health-related like asphalt, pipes, medical supplies, and cleaning materials which generally rise higher than similar household items, more in line with the NRCPI above.
- Increased pressure due to rise in costs for contracted services such as waste haulage, and software licencing for the right to use the existing technologies. Licencing cost annual increases are higher than general consumer goods increase.
- Market prices for insurance, including premiums for liability and long-term disability insurance have been increasing at a higher than most general goods and services. The market supply for some types of insurance, like cyber-risk coverage, is shrinking.
How does the City mitigate inflationary pressures?
The City first looks within with a focus on cost containment and continuous improvement to find ways to do more with less resources. Examples of some initiatives that are lowering the inflationary pressure on the budget include:
- Continuing to implement energy efficiency initiatives that mitigate utility cost increases.
- The delay between setting a budget and awarding a tender under high inflation can be a challenge as prices may have increased to an extent that the initial budget is no longer sufficient to do the work. Staff have developed several policies to assist with this challenge and to reduce procurement lead times.
- Workflow and process automation, reducing the cost of paper, printing costs, staff time, and increasing capacity. The 2023 budget dedicates funding for new systems to improve efficiency.
- A hybrid environment and virtual meetings to reduce mileage costs and staff time commuting between facilities.
- Ongoing review and updating of procurement documents and contracts to mitigate City risk.
- Investing in innovation and modernizing payment options for customers and residents.
- Leveraging reserves to smooth out large cost increases and spread them over a longer period of time. This is one advantage of multi-year budgets.
- Utilizing temporary surpluses caused by labour market pressures and contingency reserves to allow for time to assess whether inflationary pressures are temporary in nature or represent a permanent increase to the cost structure of the organization.
Staff continue to monitor the impacts and have addressed inflationary impacts on capital budgets through the prioritization process undertaken in 2022 for 2022 and 2023. Operating budget impacts have been identified and staff have proposed a strategy that uses operating surpluses resulting from the tight labour market to offset inflationary impacts, providing time to continue to monitor and assess conditions in 2023 with a plan to incorporate any adjustments required into the next 2024-2027 multi-year budget cycle.